The Challenge: The Budgeting Black Box
The existing full-funnel budget forecasting feature was complex, static, and lacked user trust. Enterprise Marketing VPs were spending days in external spreadsheets, manually calculating the cascading impact of budget changes (e.g., how an increase in Google Ads spend affects final revenue). The in-platform tool was viewed as a reporting artifact, not a living planning tool.
The Problem & Key Insight
Marketing leaders needed to confidently answer: "If I allocate X budget to Channel Y, what is the predictable revenue output 6 months from now?" The existing tool failed because it hid the underlying assumptions. Users didn't trust the automated forecast unless they could see and modify the core variables (like Conversion Rates and Channel Costs) that drove the predictions. They needed a "What-If" engine, not just a single forecast output.
The Spreadsheet Abyss:
Quarterly planning meant exporting data from various systems (CRM, Ads, Web Analytics), compiling complex spreadsheets, and manually calculating conversion rates between funnel stages.
Lack of Foresight:
Users could see historical performance but struggled to confidently answer the critical "what-if" questions: If I increase my LinkedIn spend by $50k, how many more opportunities will the sales team receive next quarter?
Mistrust in the Data:
Because the process was manual, the resulting budget was often scrutinized by the CFO/CRO, leading to constant revisions and friction.
Improve User Satisfaction:
Create a simple, secure, and transparent payment management experience.
Outcomes and Impact
The Full-Funnel Forecasting Feature was released as a premium module to our enterprise client base.
Forecast Accuracy
Before updates: 60% average, after update: 82% average; up 22% (Exceeded 20% goal, showing a more reliable product)
Budget Creation
Before the re-design and updates to forecasting it took an average of 3-4 days of manual work to create budgets, now it takes 4 hours in-app. 90% faster.
Adoption Rate
75% of target enterprise clients using the feature monthly.
Business Impact
Contributed to a 15% lift in average contract value (ACV) for clients on the premium tier.
Design Process
My process included working with stakeholders, leadership, product, engineering and data scientists to re-design the existing forecasting tool for our enterprise partners.
Discovery:
Conducted contextual inquiry sessions with 10 Marketing VPs to map the 3-day manual budgeting process in detail, identifying the precise pain points (manual data entry, lack of comparison).
Ideation & Wireframing:
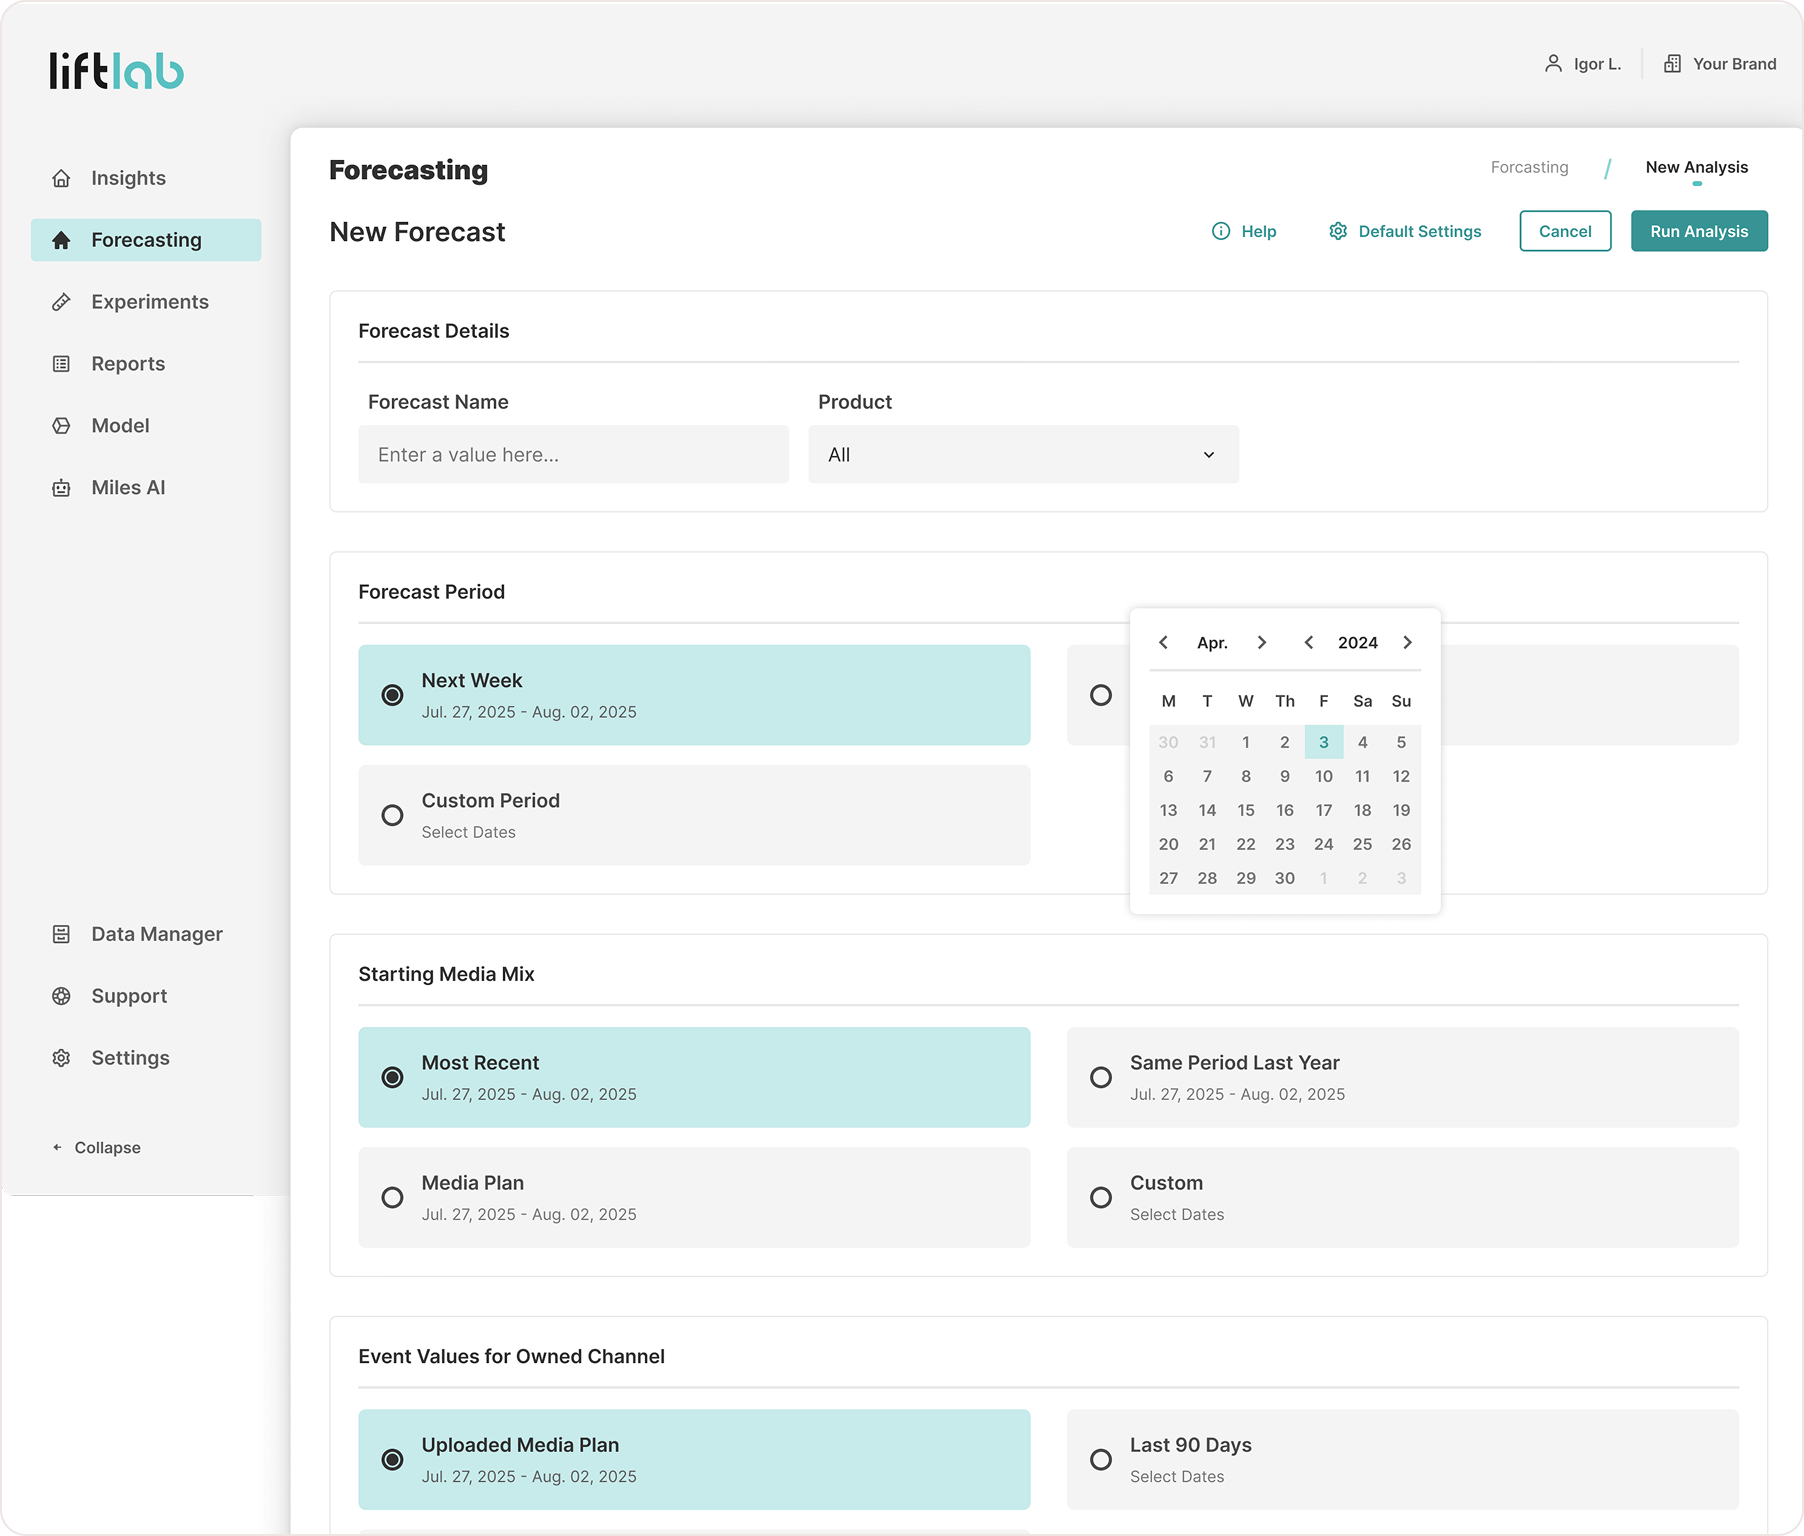
Sketched a "Direct Manipulation" model, where input controls were placed directly adjacent to the data visualization, eliminating the need to jump between input forms and results.
Prototyping & Testing:
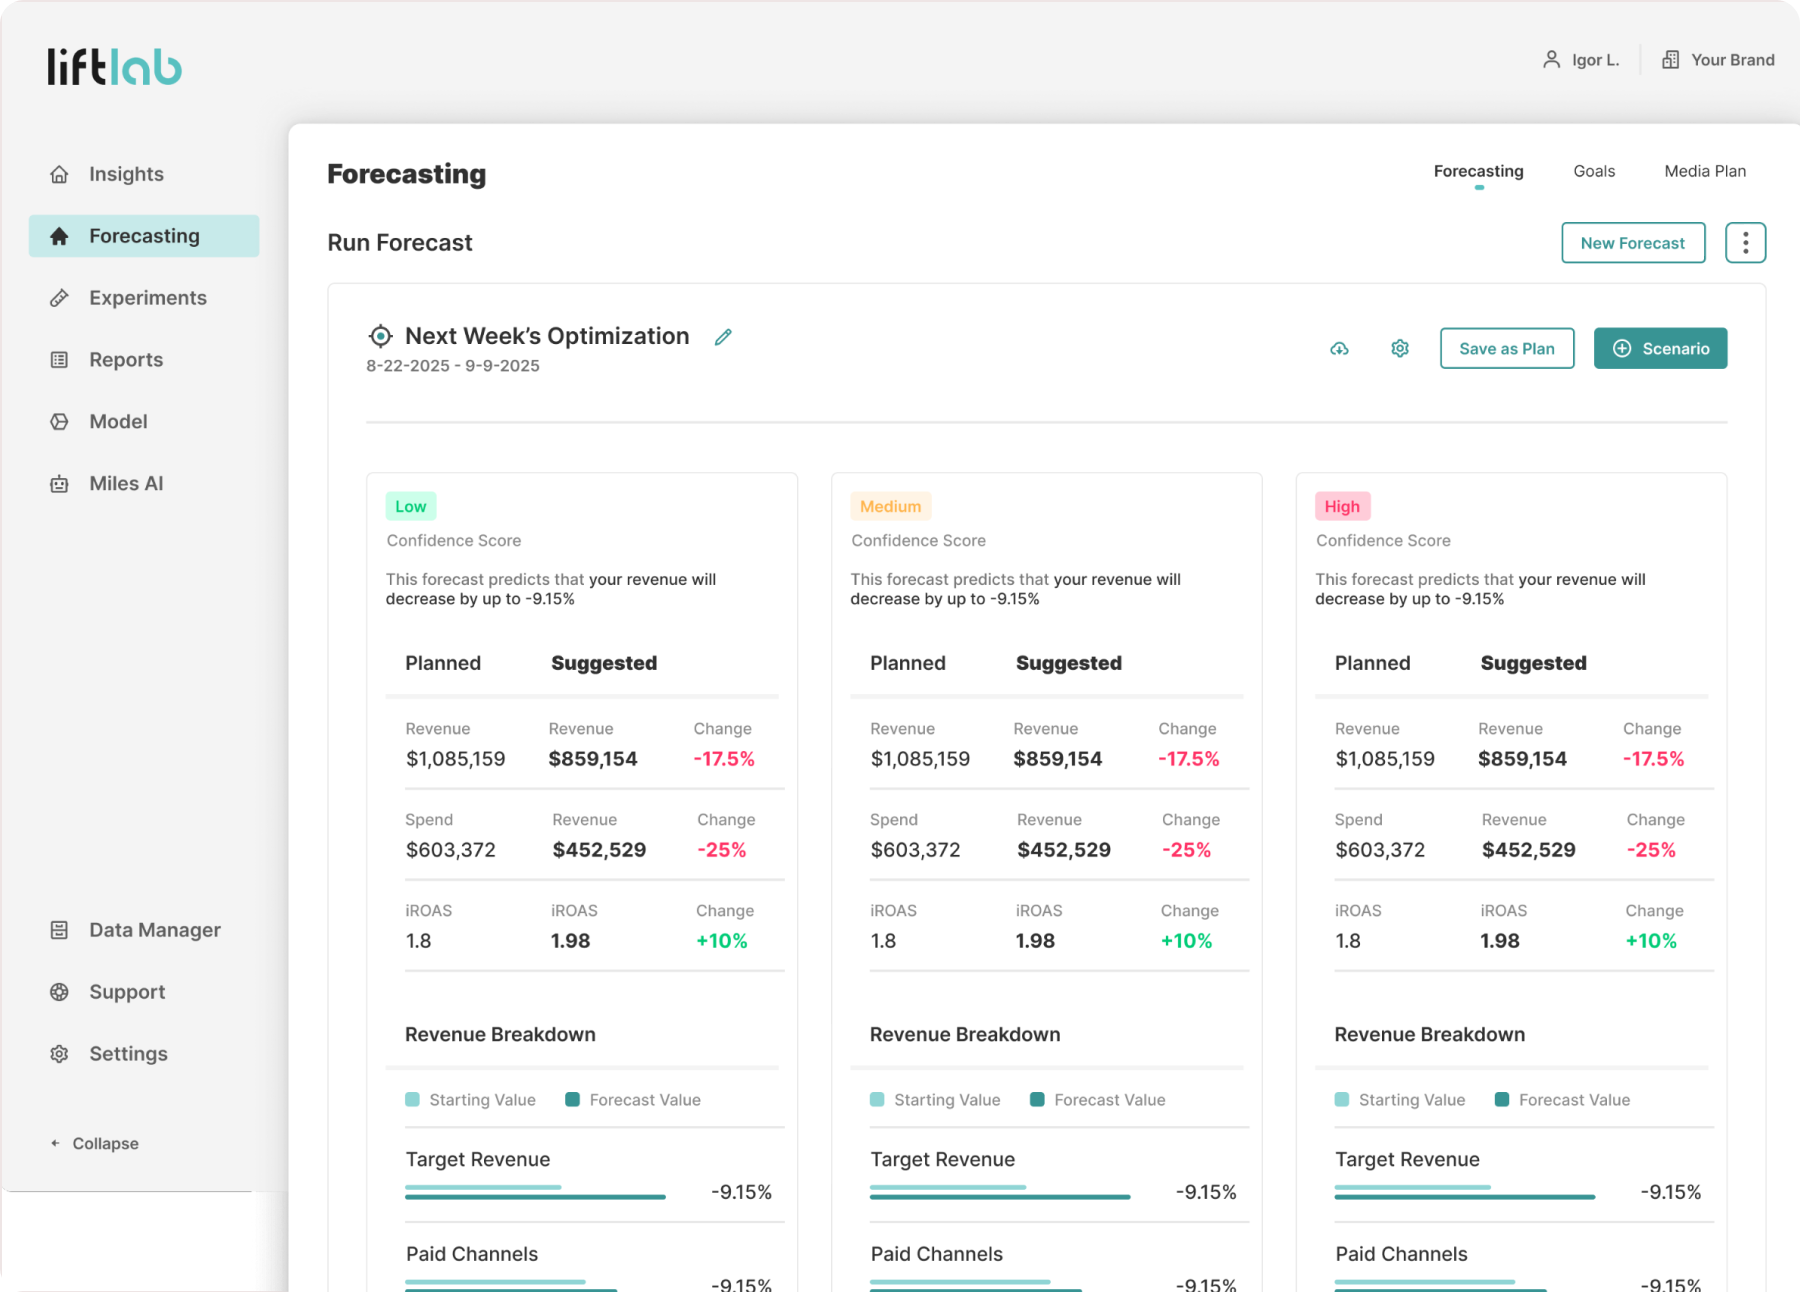
Built high-fidelity prototypes in Figma focused on the Scenario Comparison flow. Usability tests revealed that clear, simple data visualization (bar charts overlaying scenario predictions) was preferred over dense data tables.
Handoff:
Created a modular component library for the new interactive inputs and funnel visualization, ensuring consistency and accelerated engineering development.
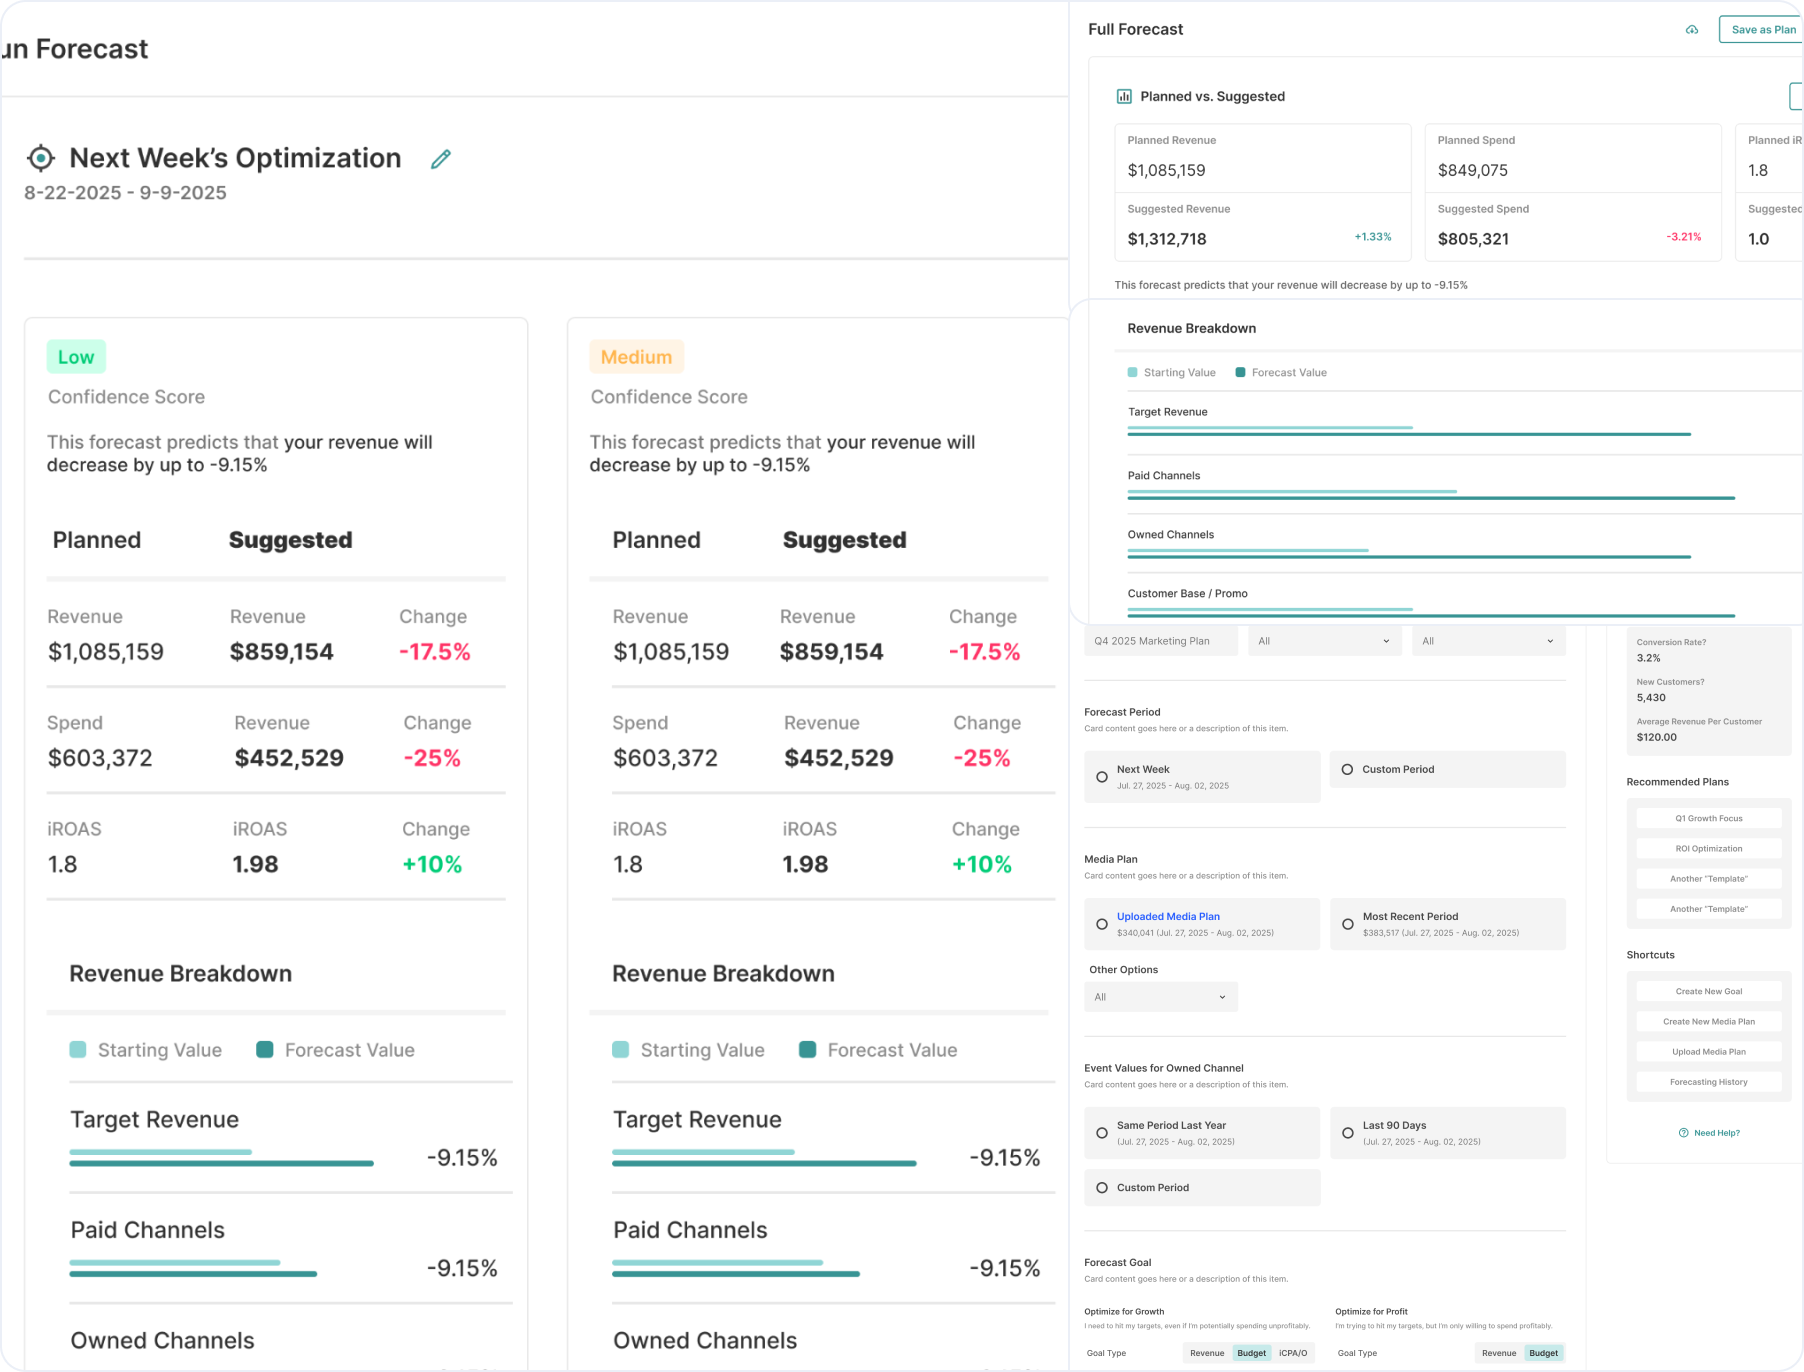
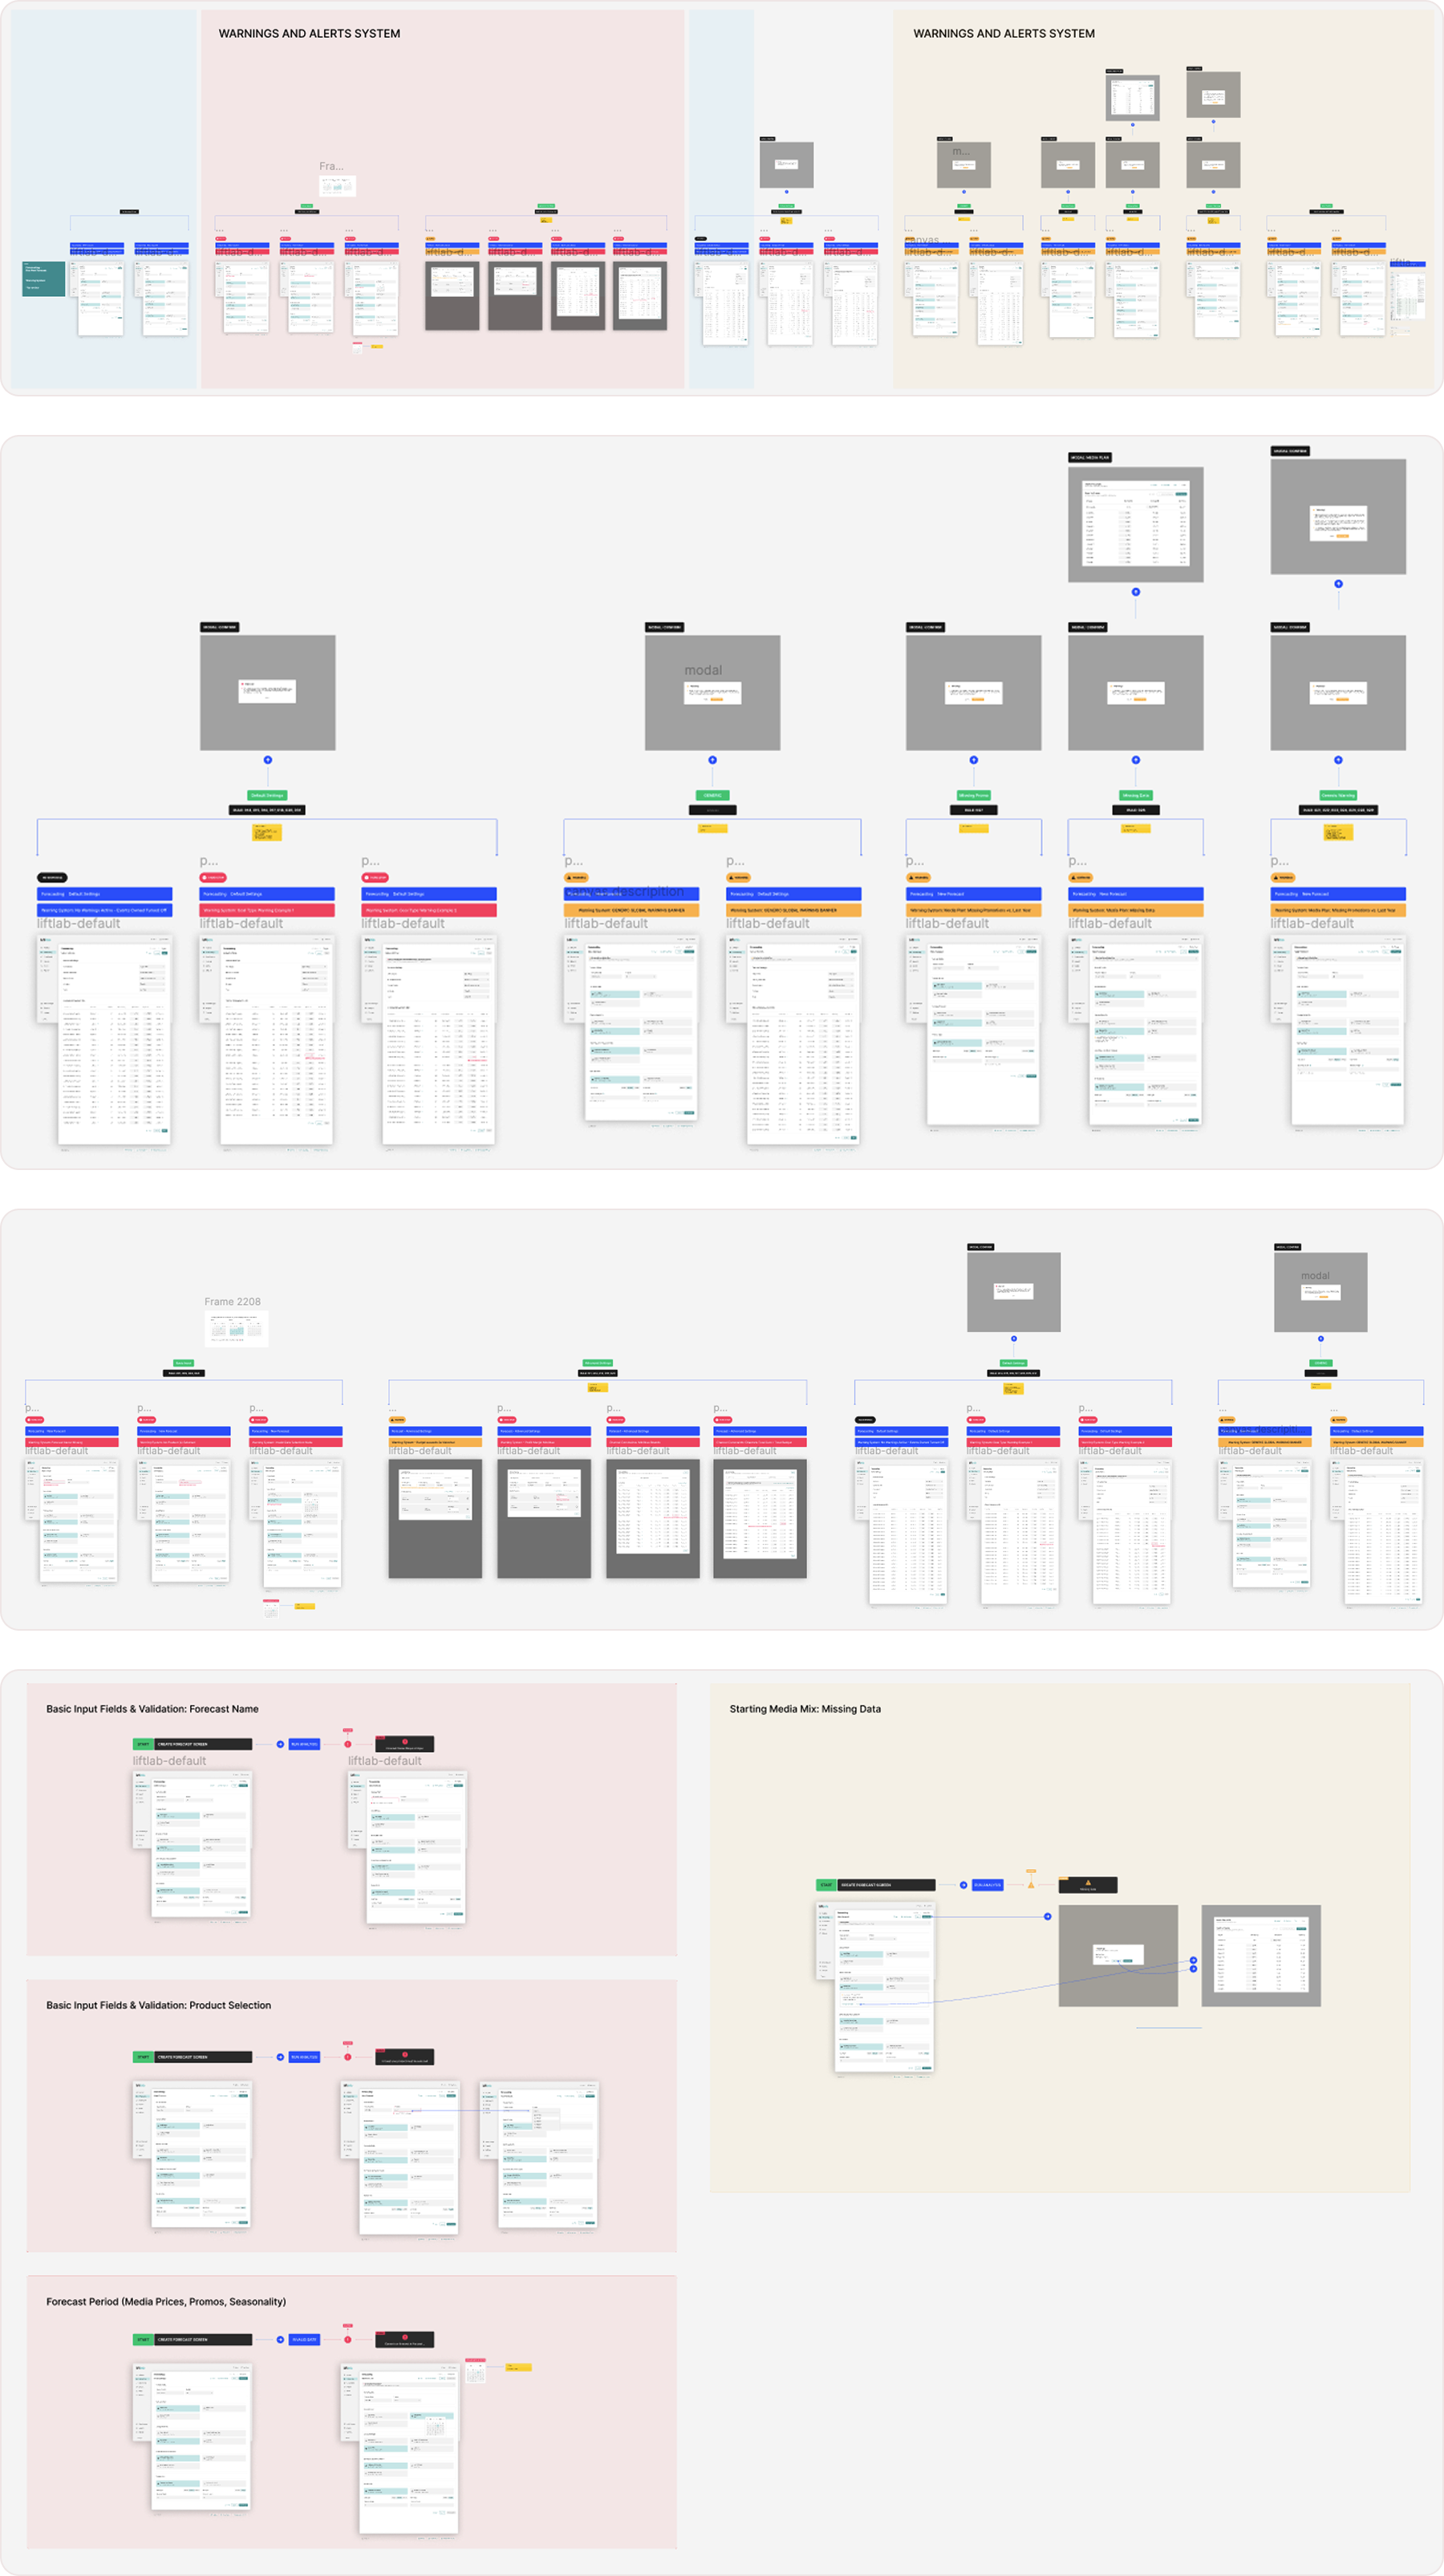
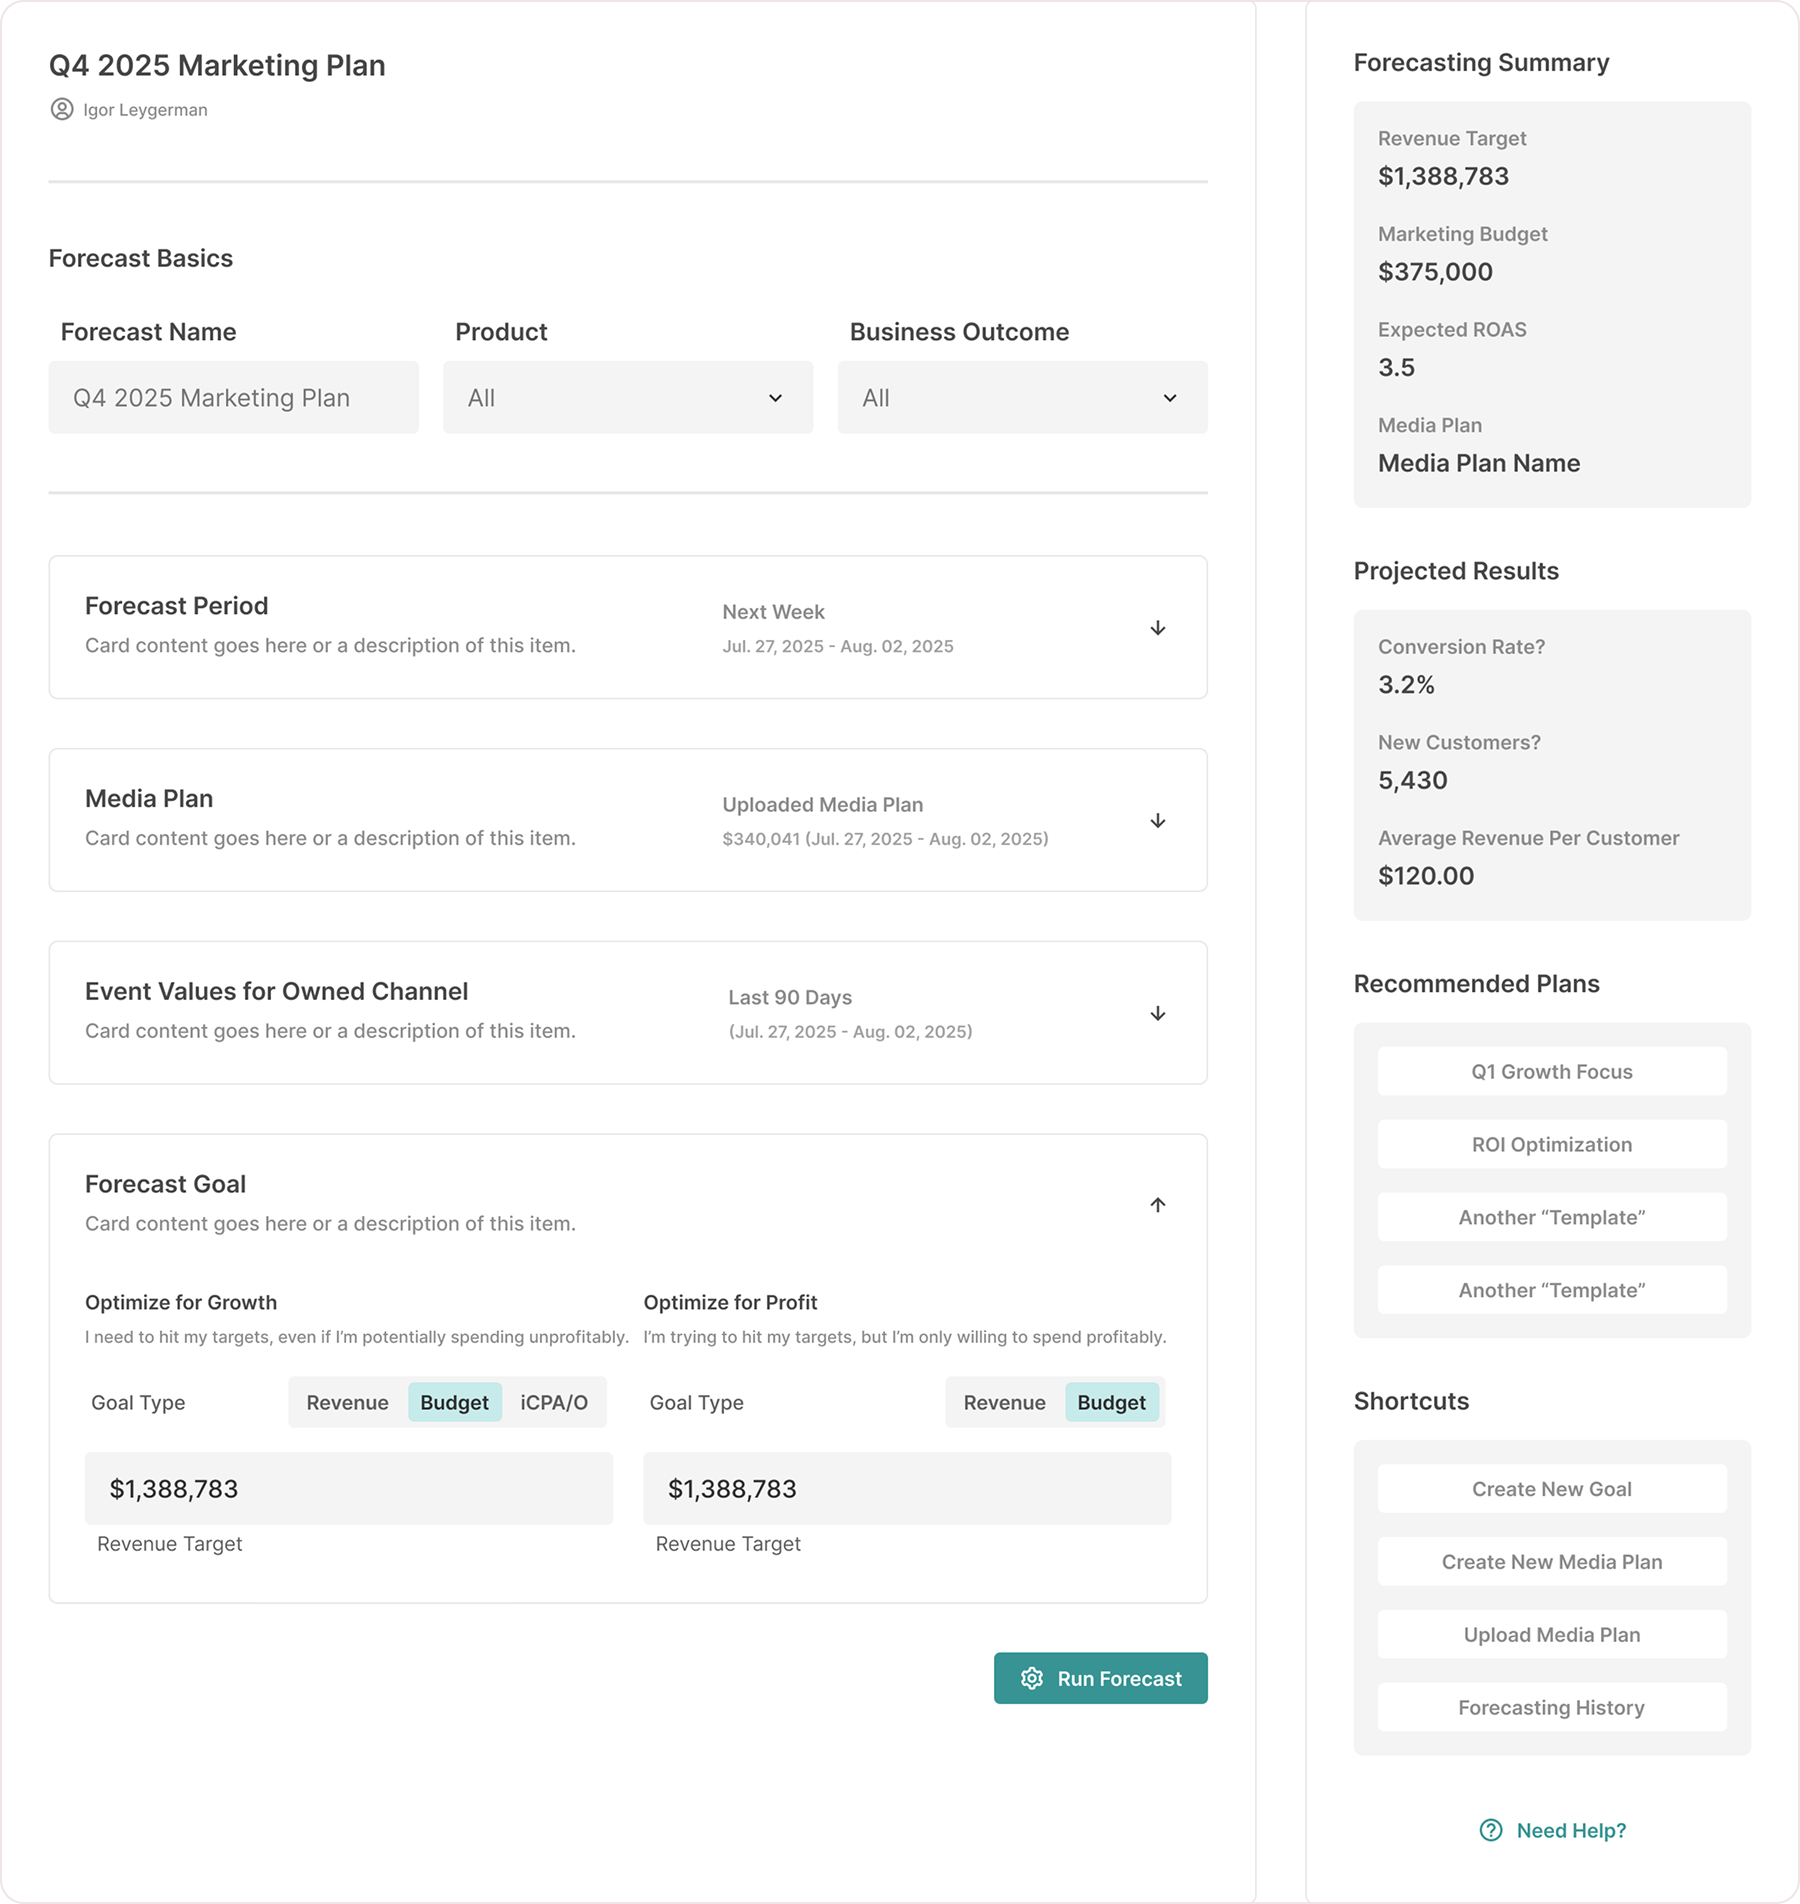
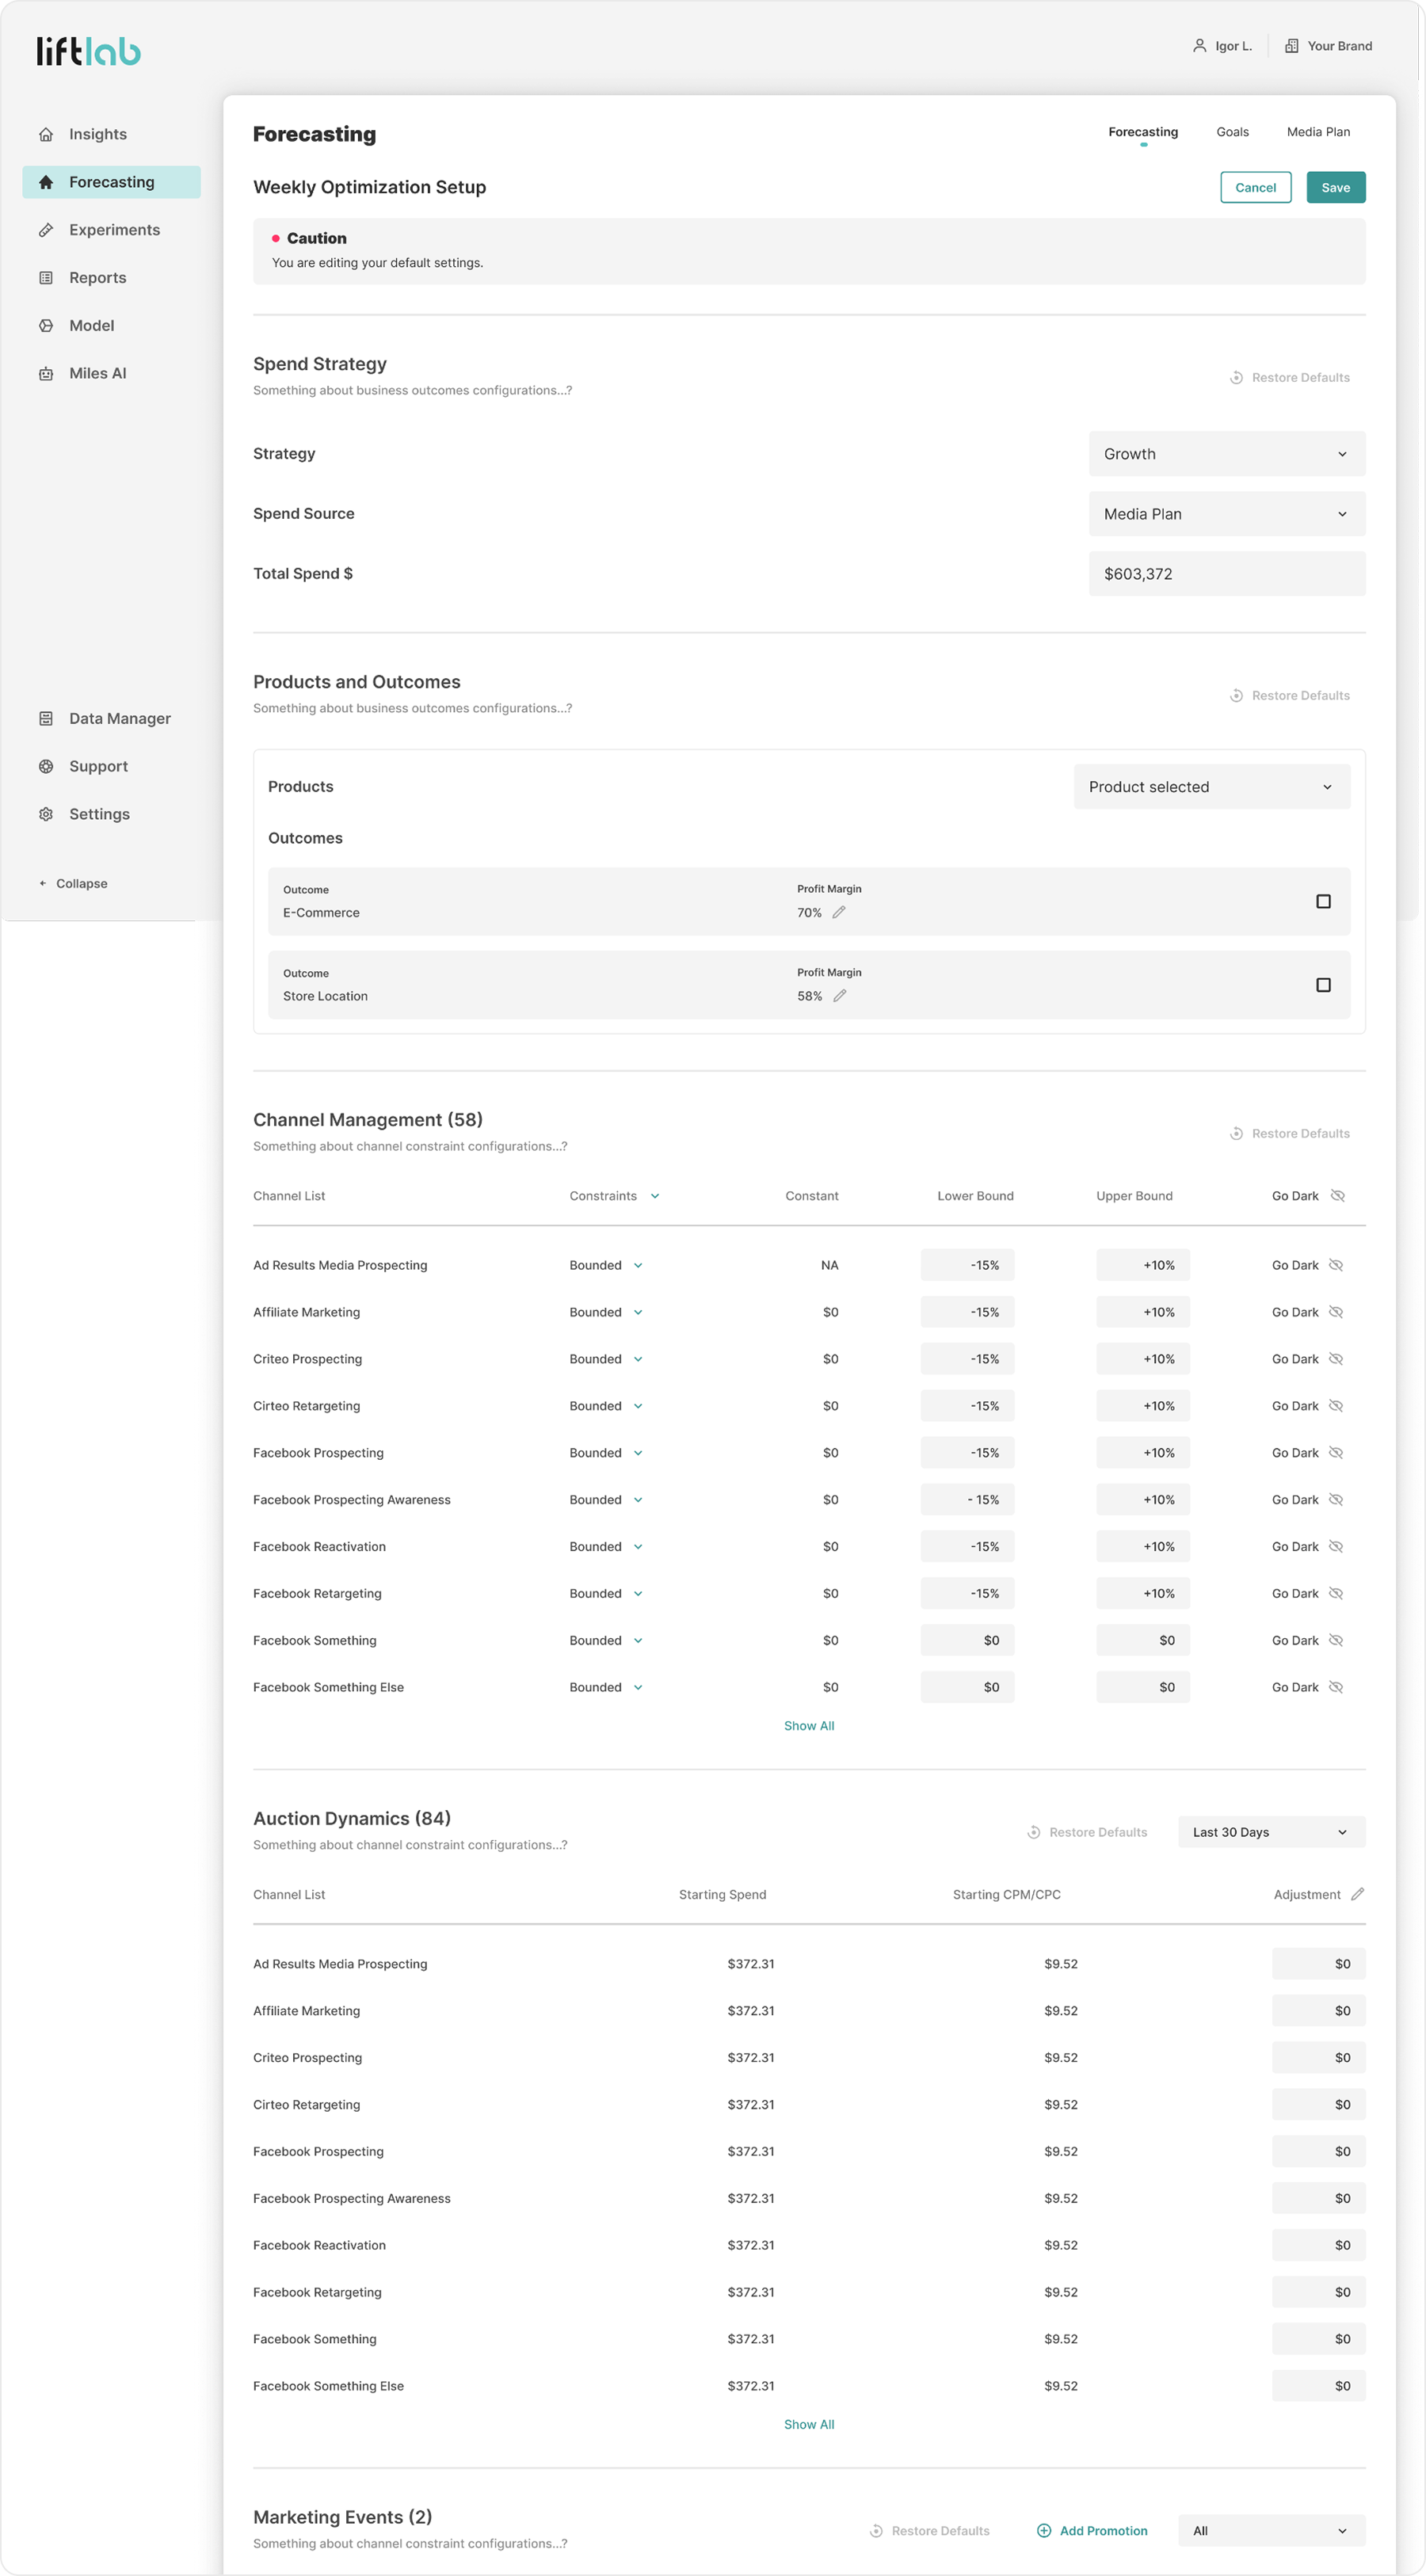
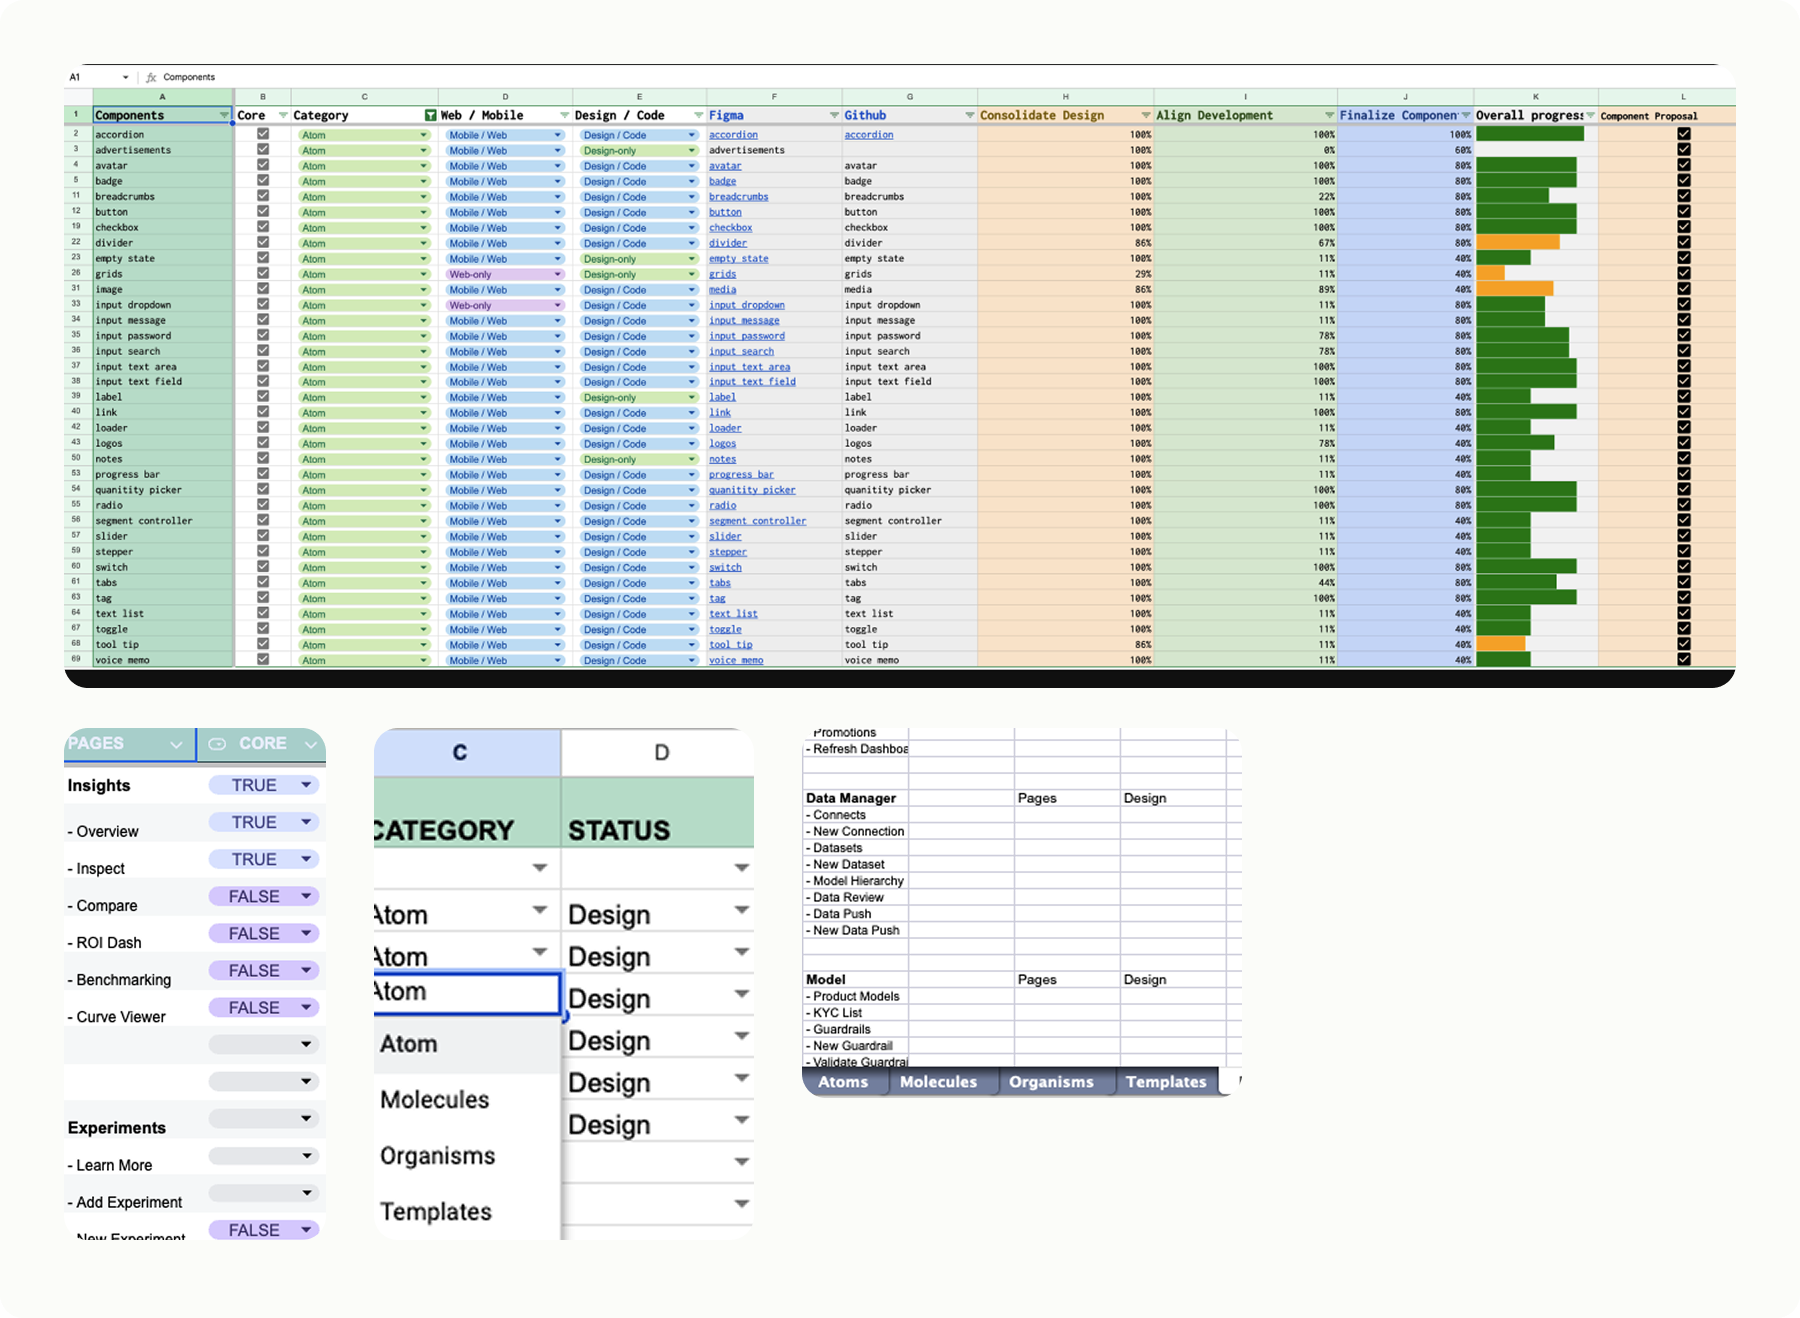
WIREFRAMES AND COMPONENTS
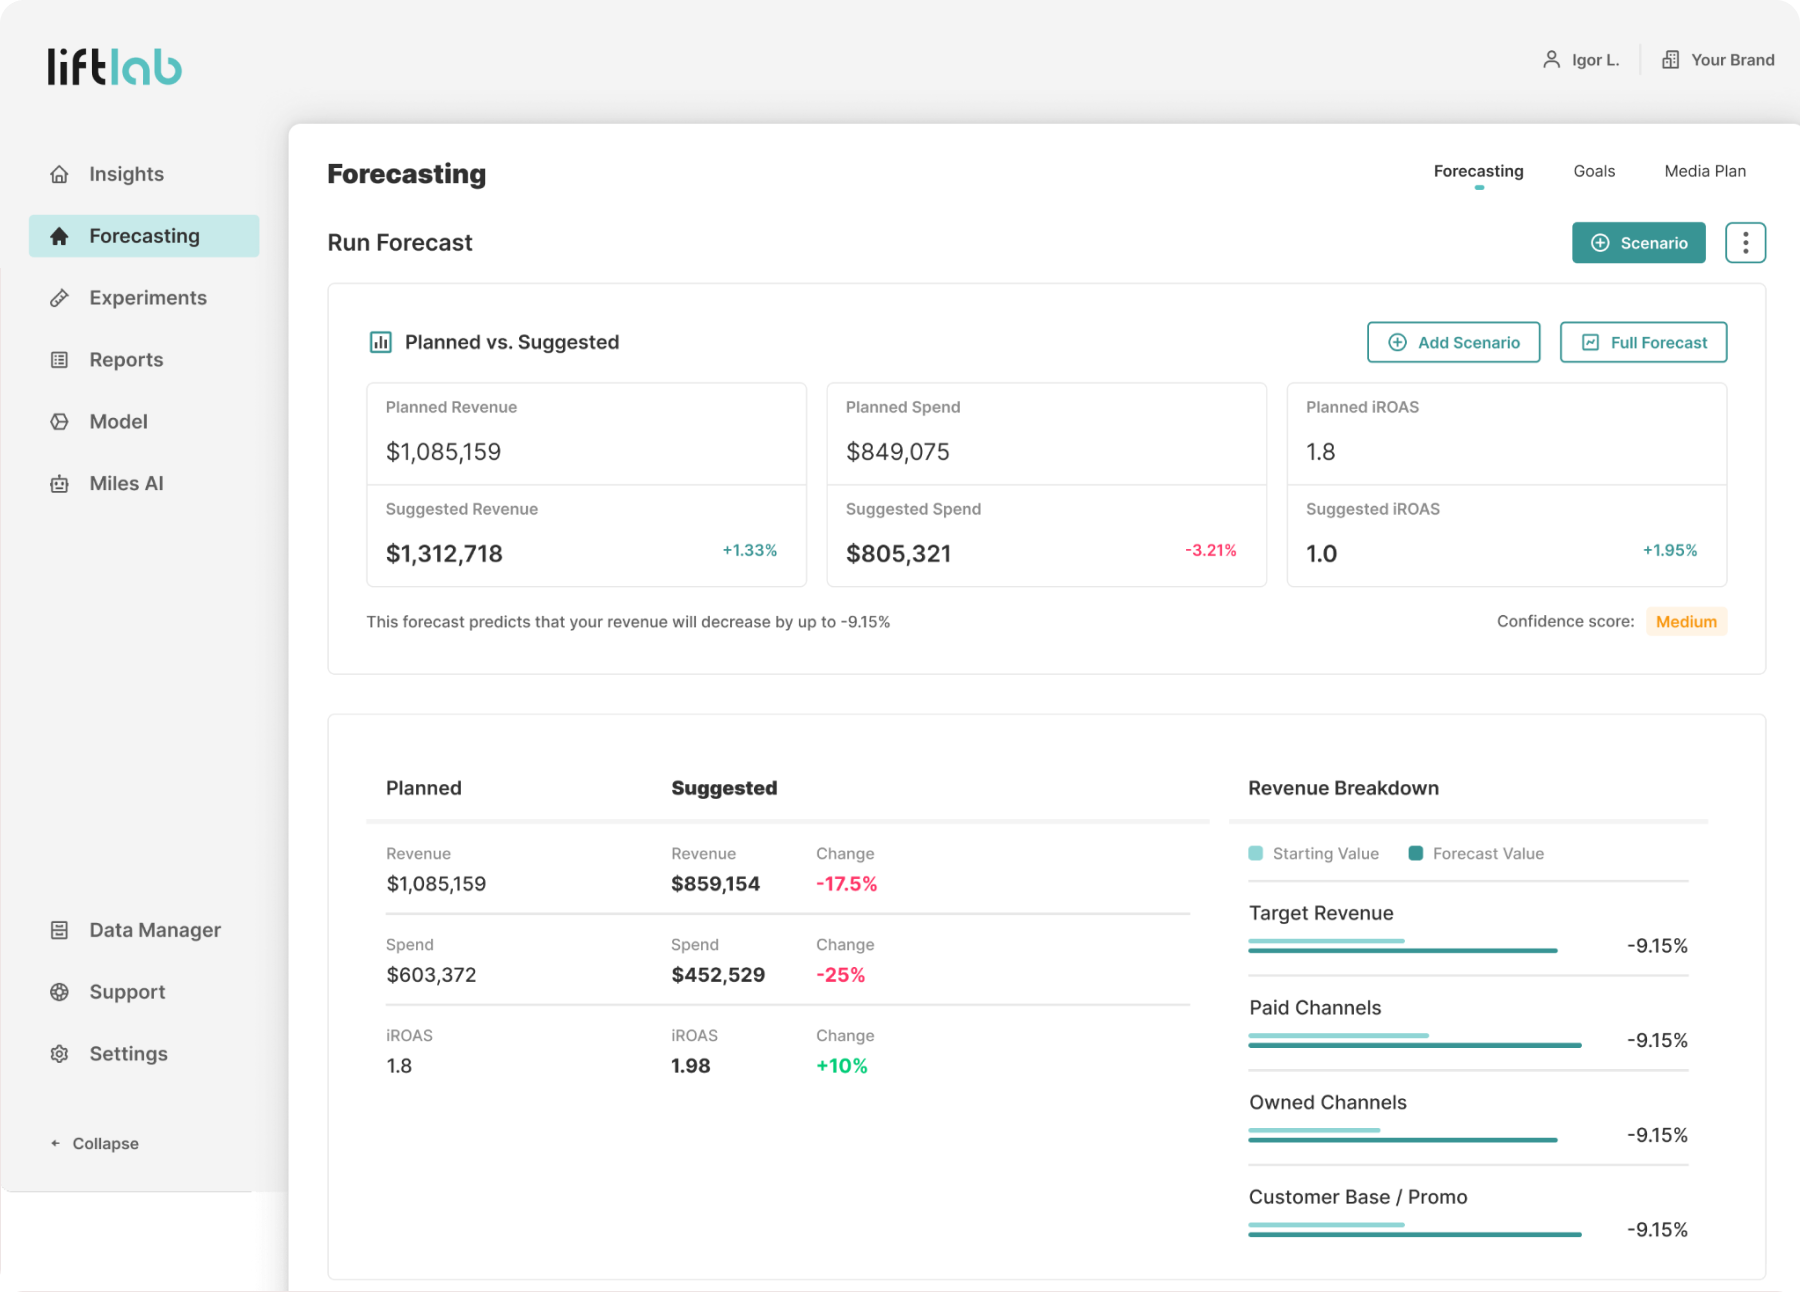
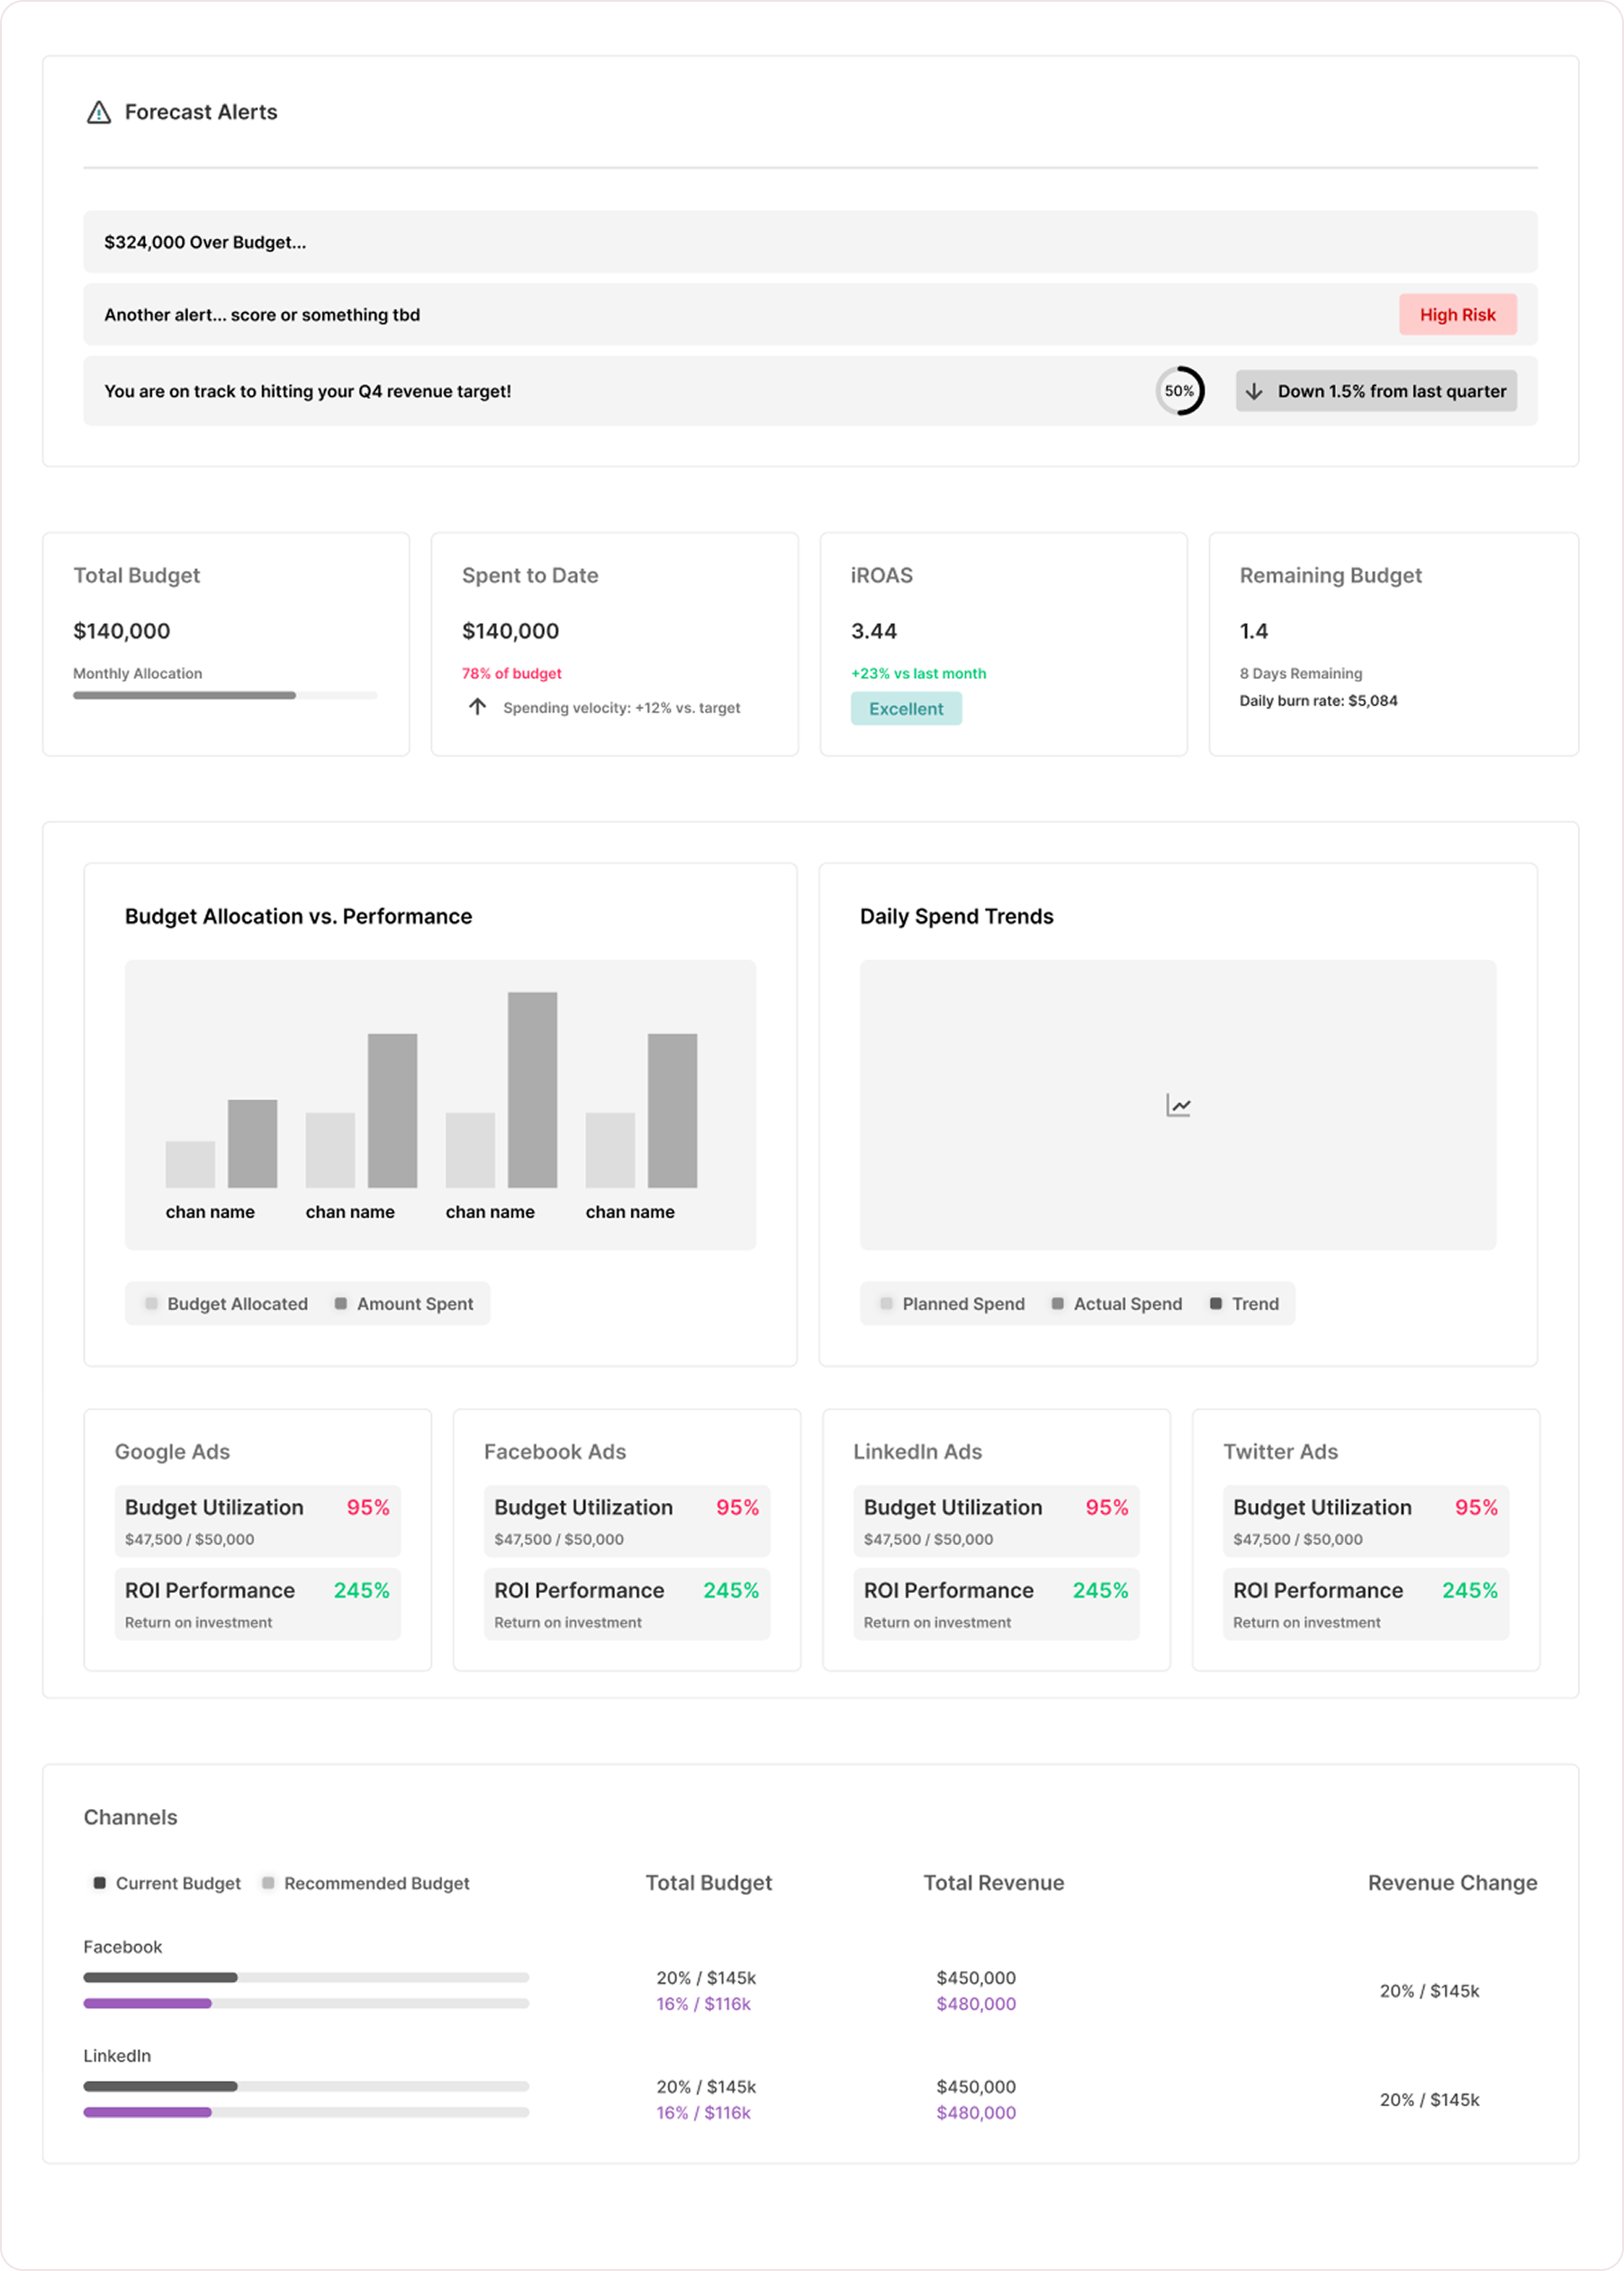
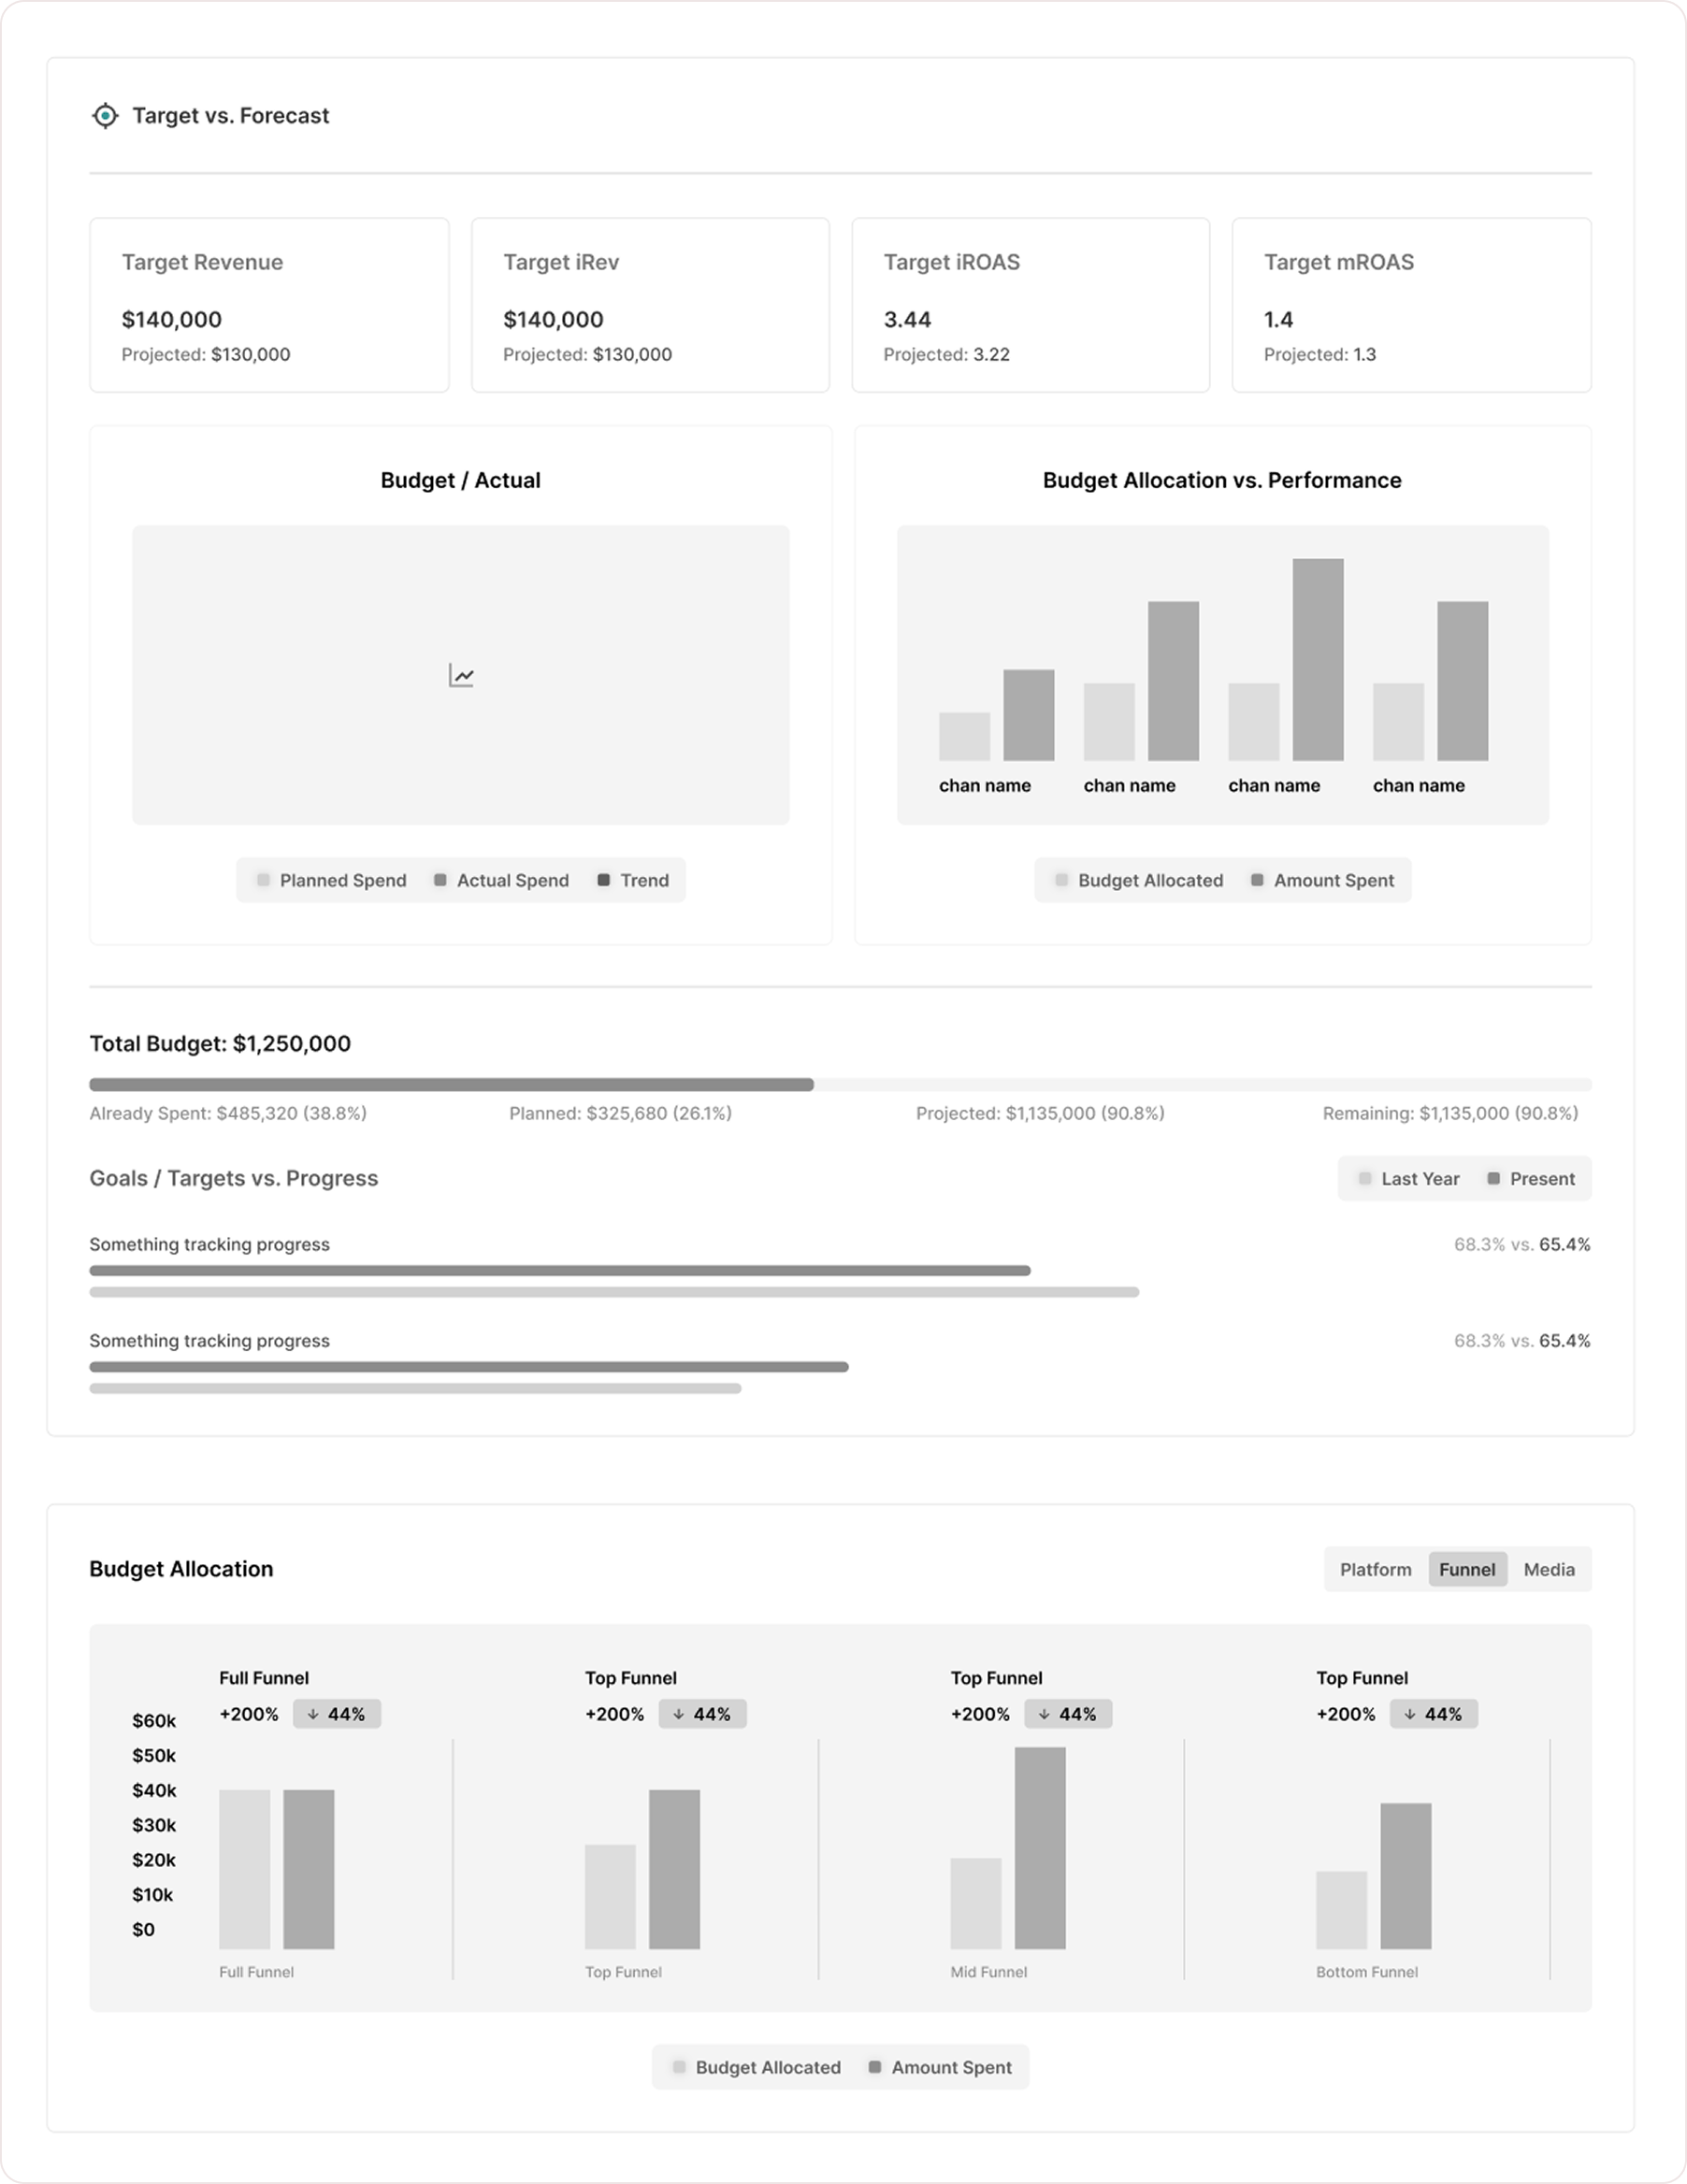
Forecast Results Dashboard and Creating a Forecast Components
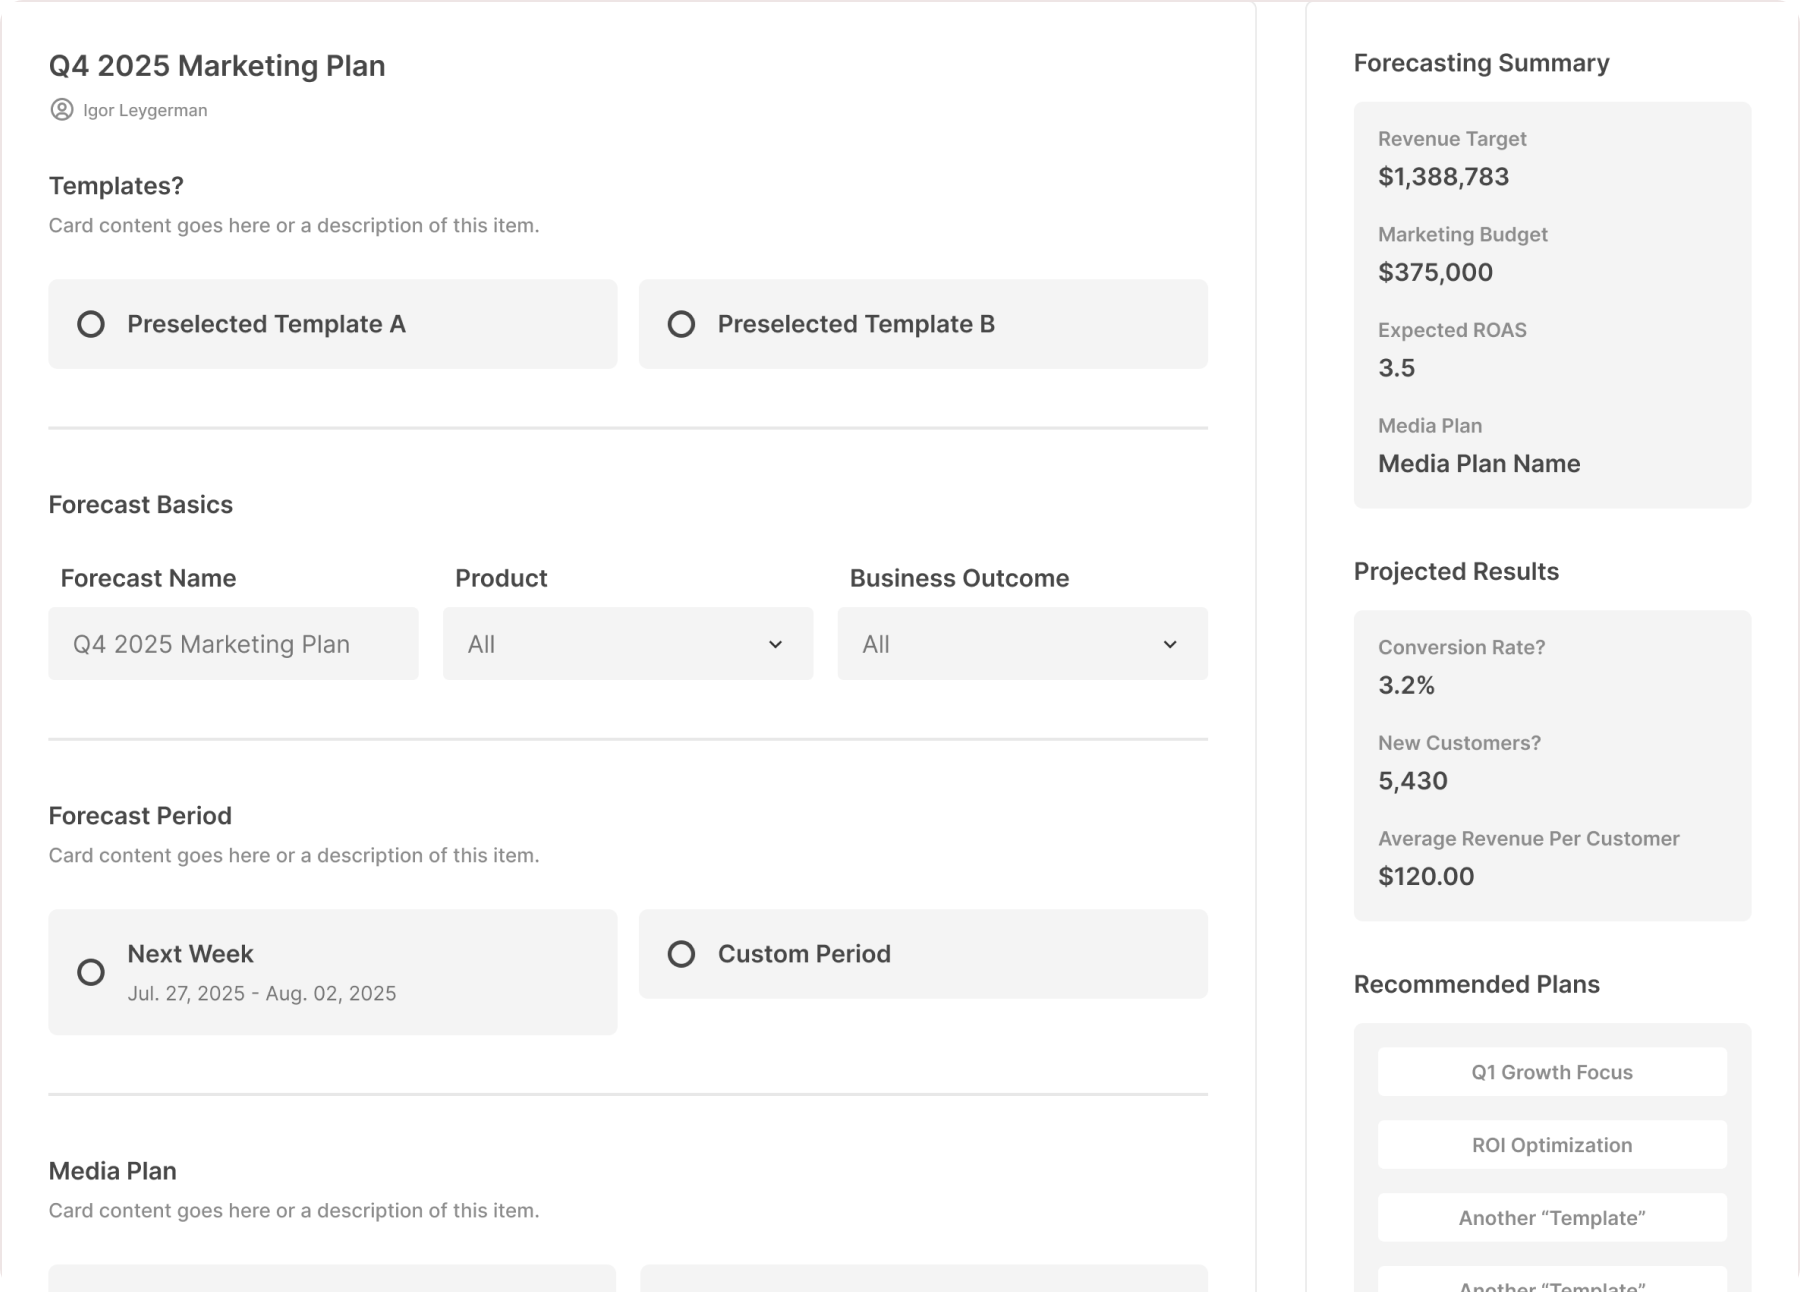
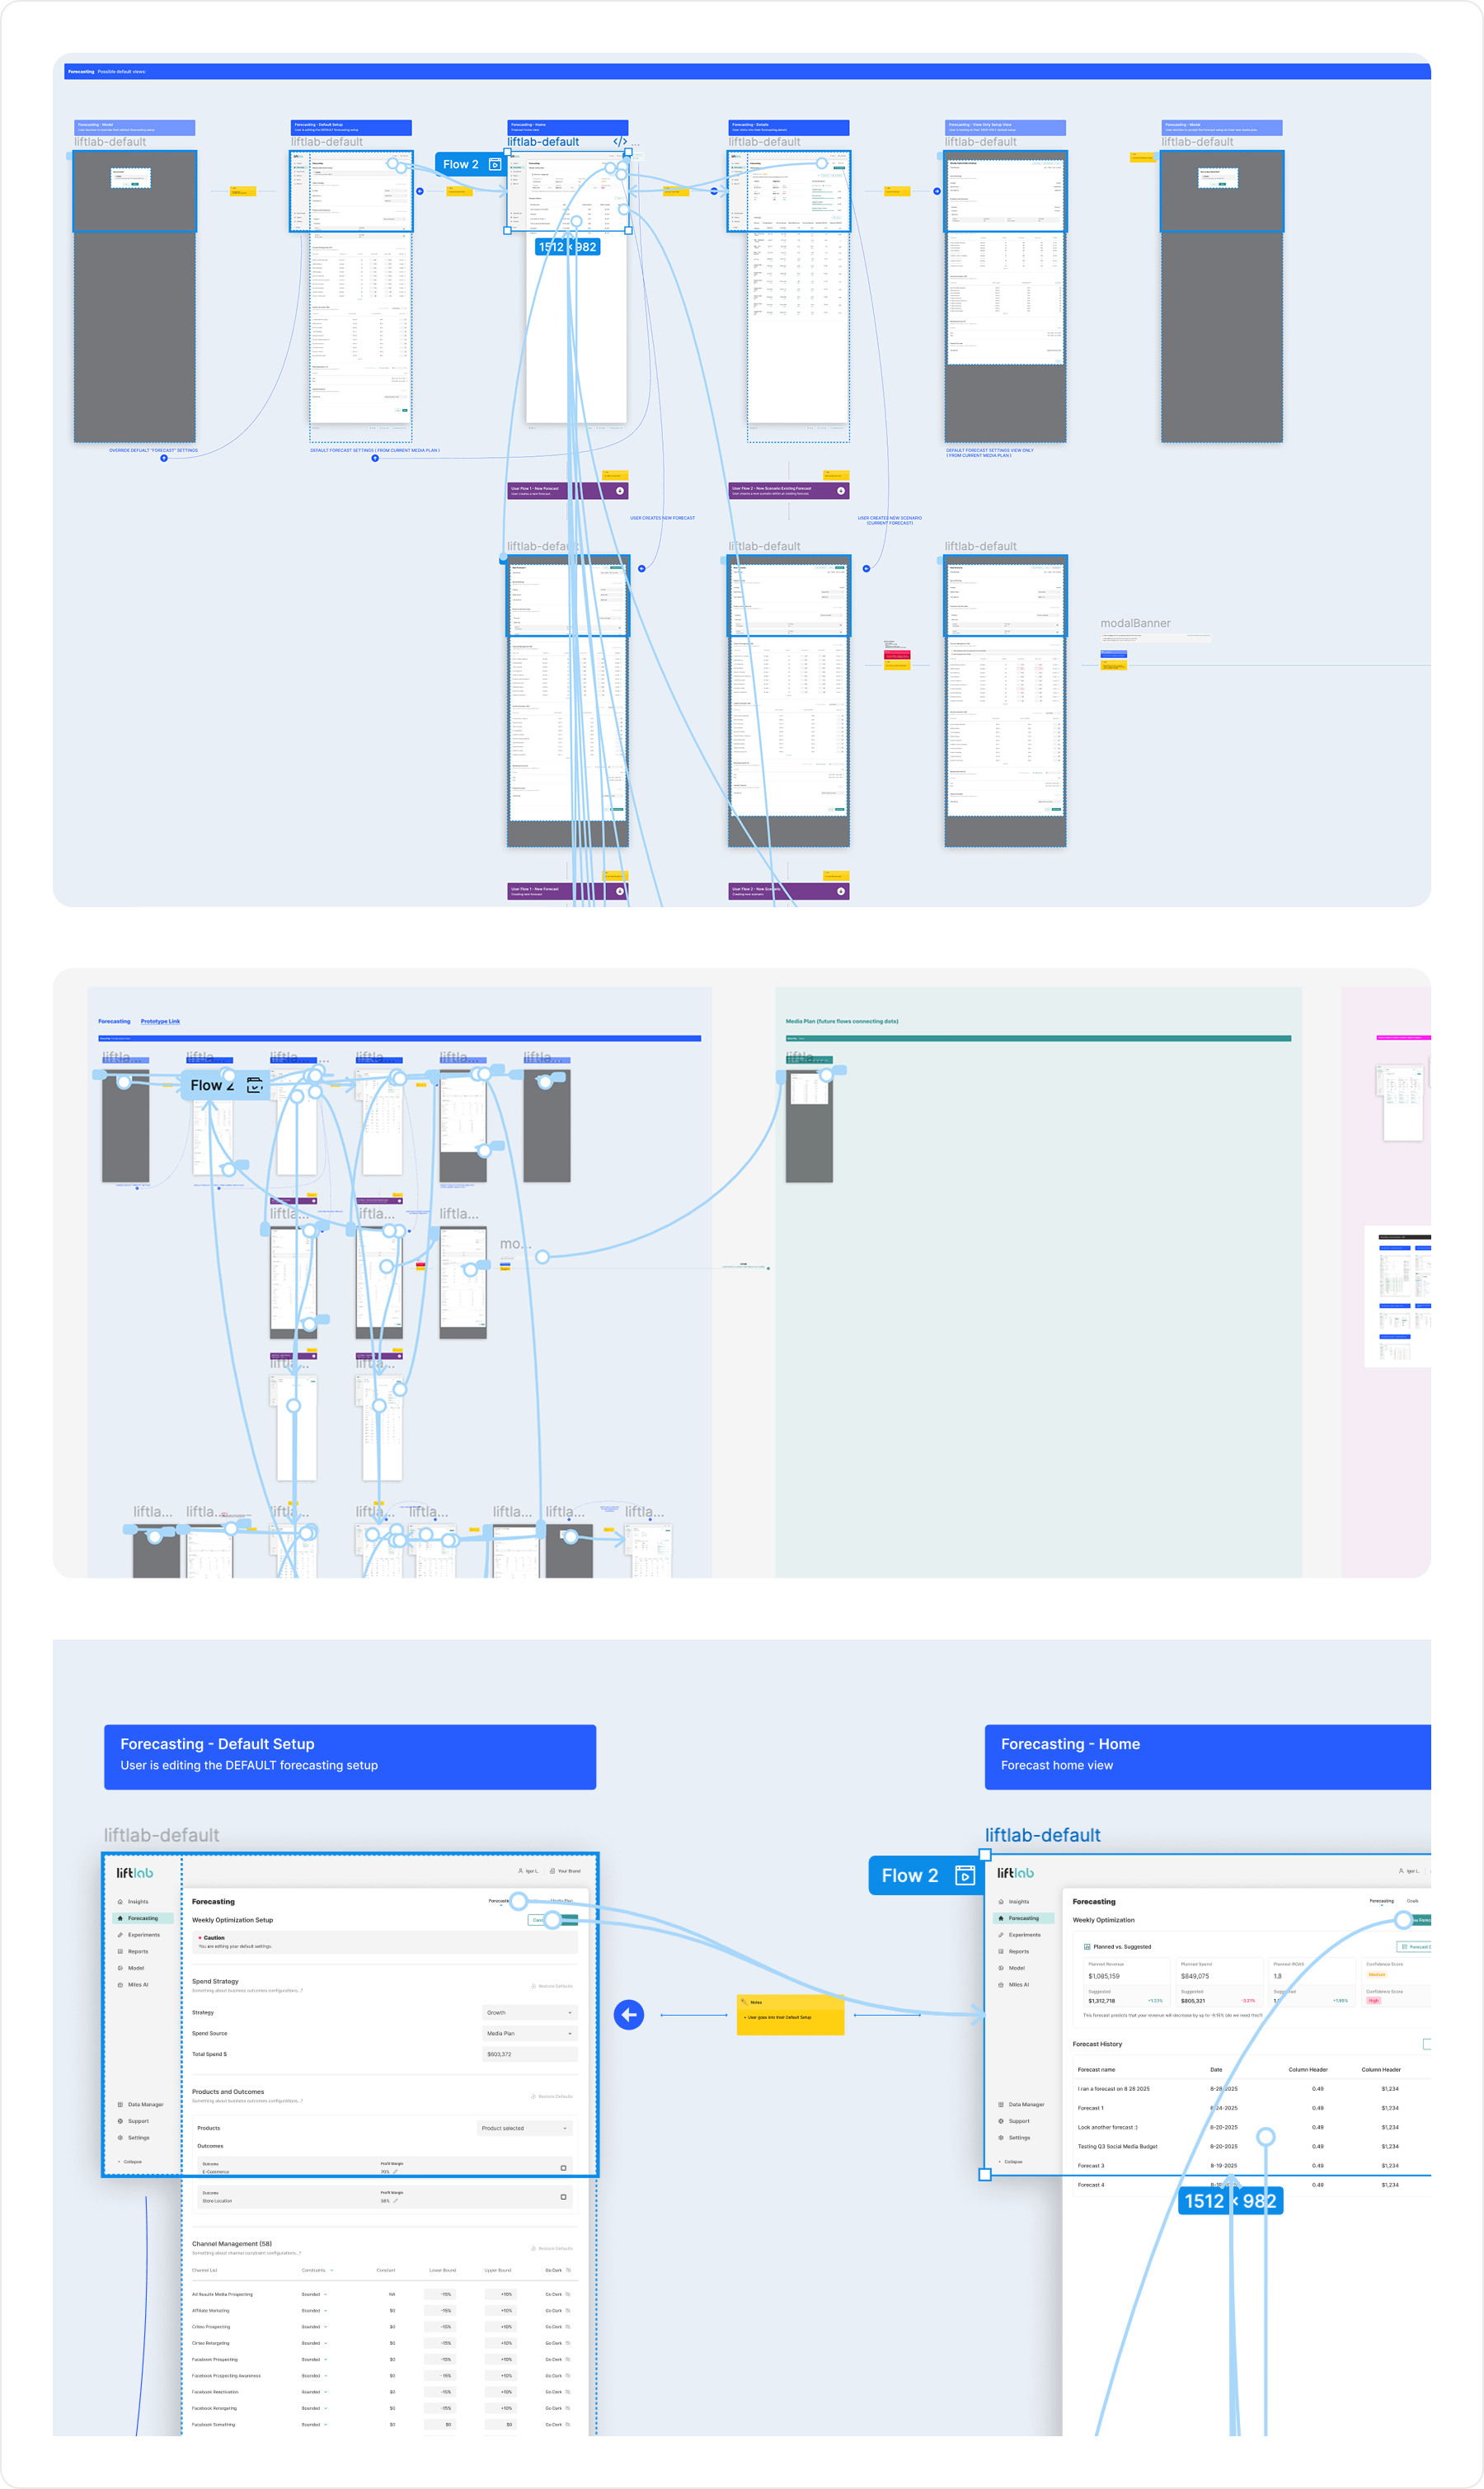
USER FLOWS AND PROTOTYPES
Forecast: Creating and Running a Forecast
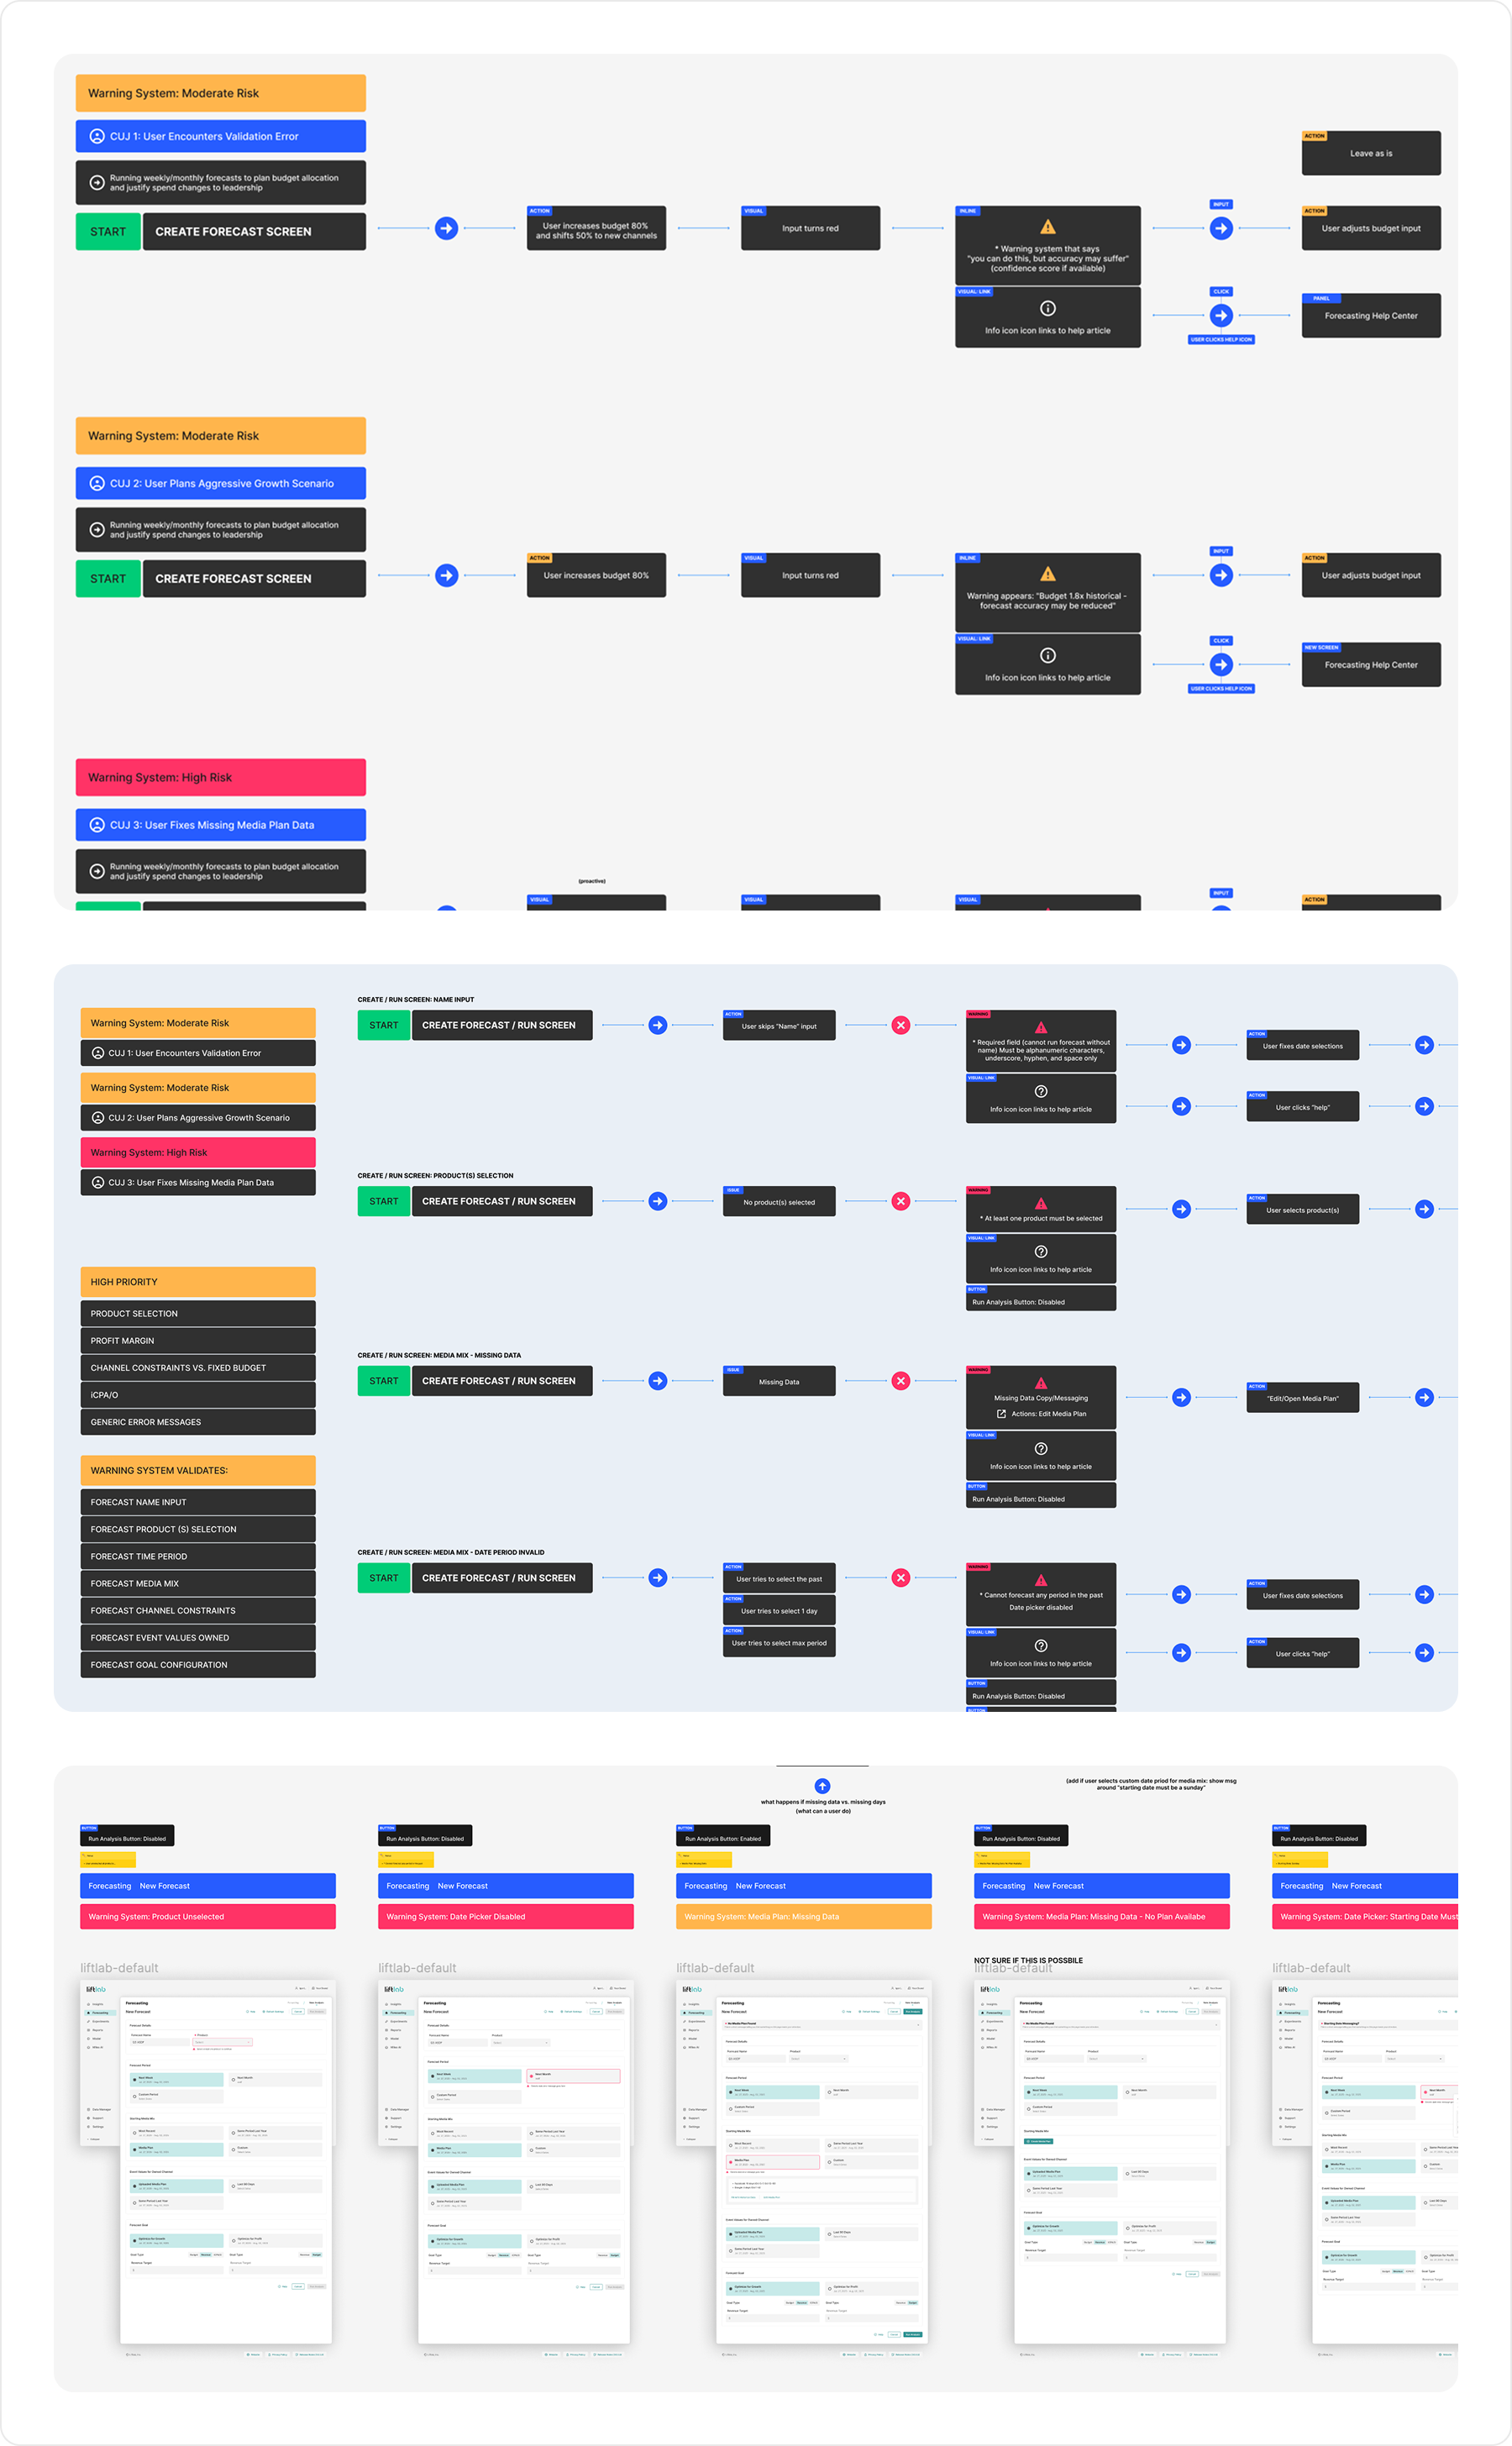
WARNING SYSTEMS USER FLOWS
New Design System Components and Documentation
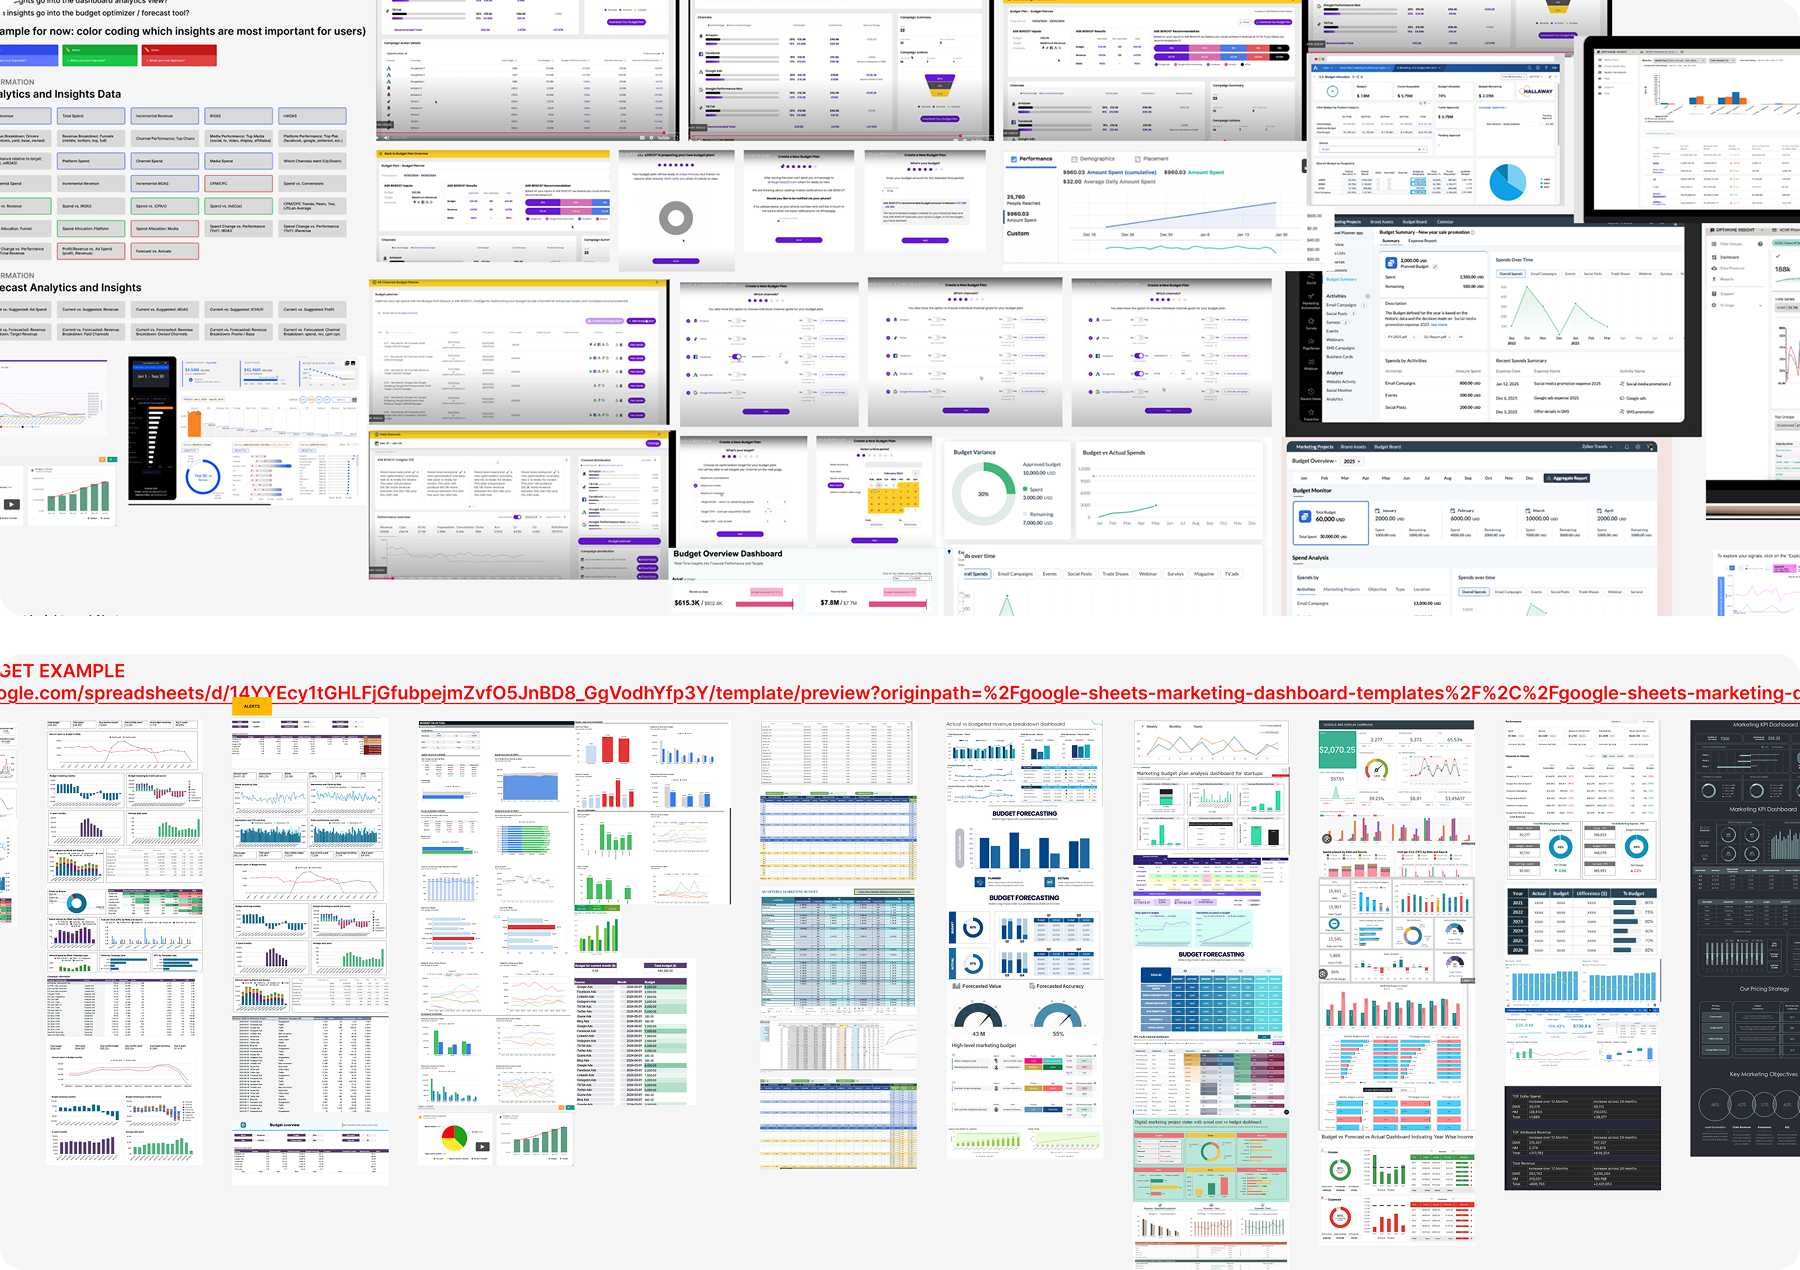
MARKET RESEARCH
Forecast Dashboars and Results Screens