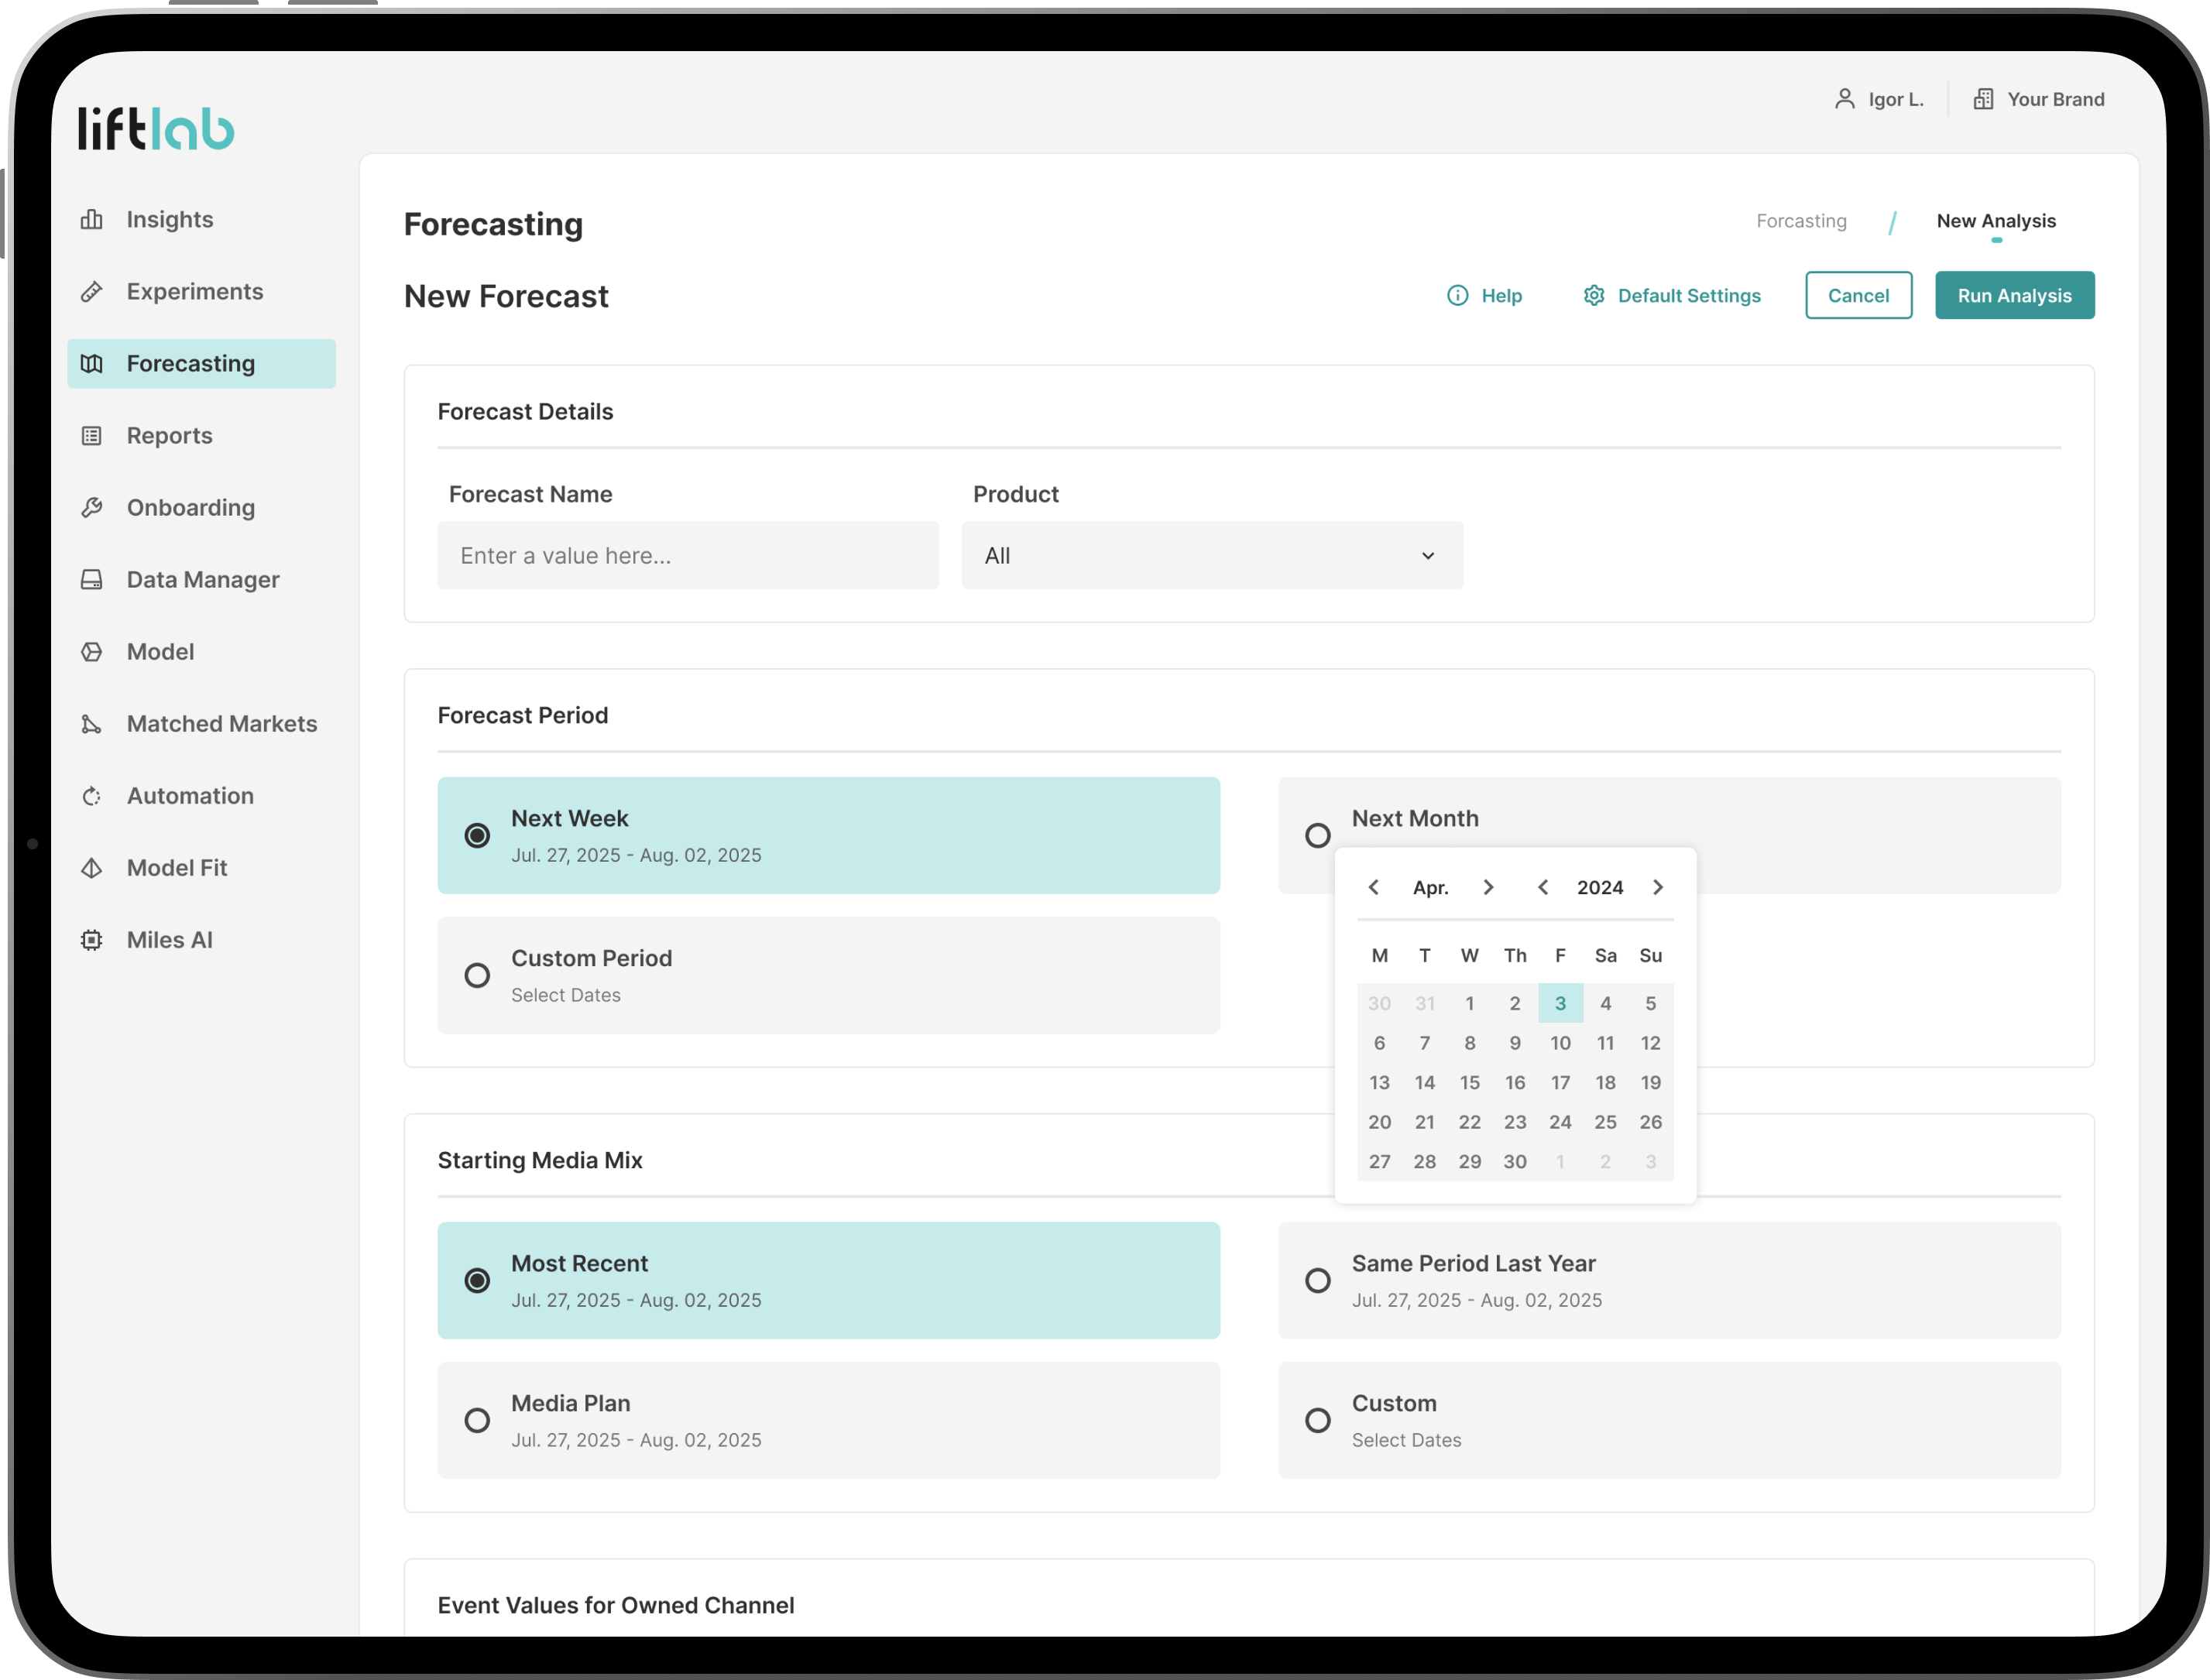
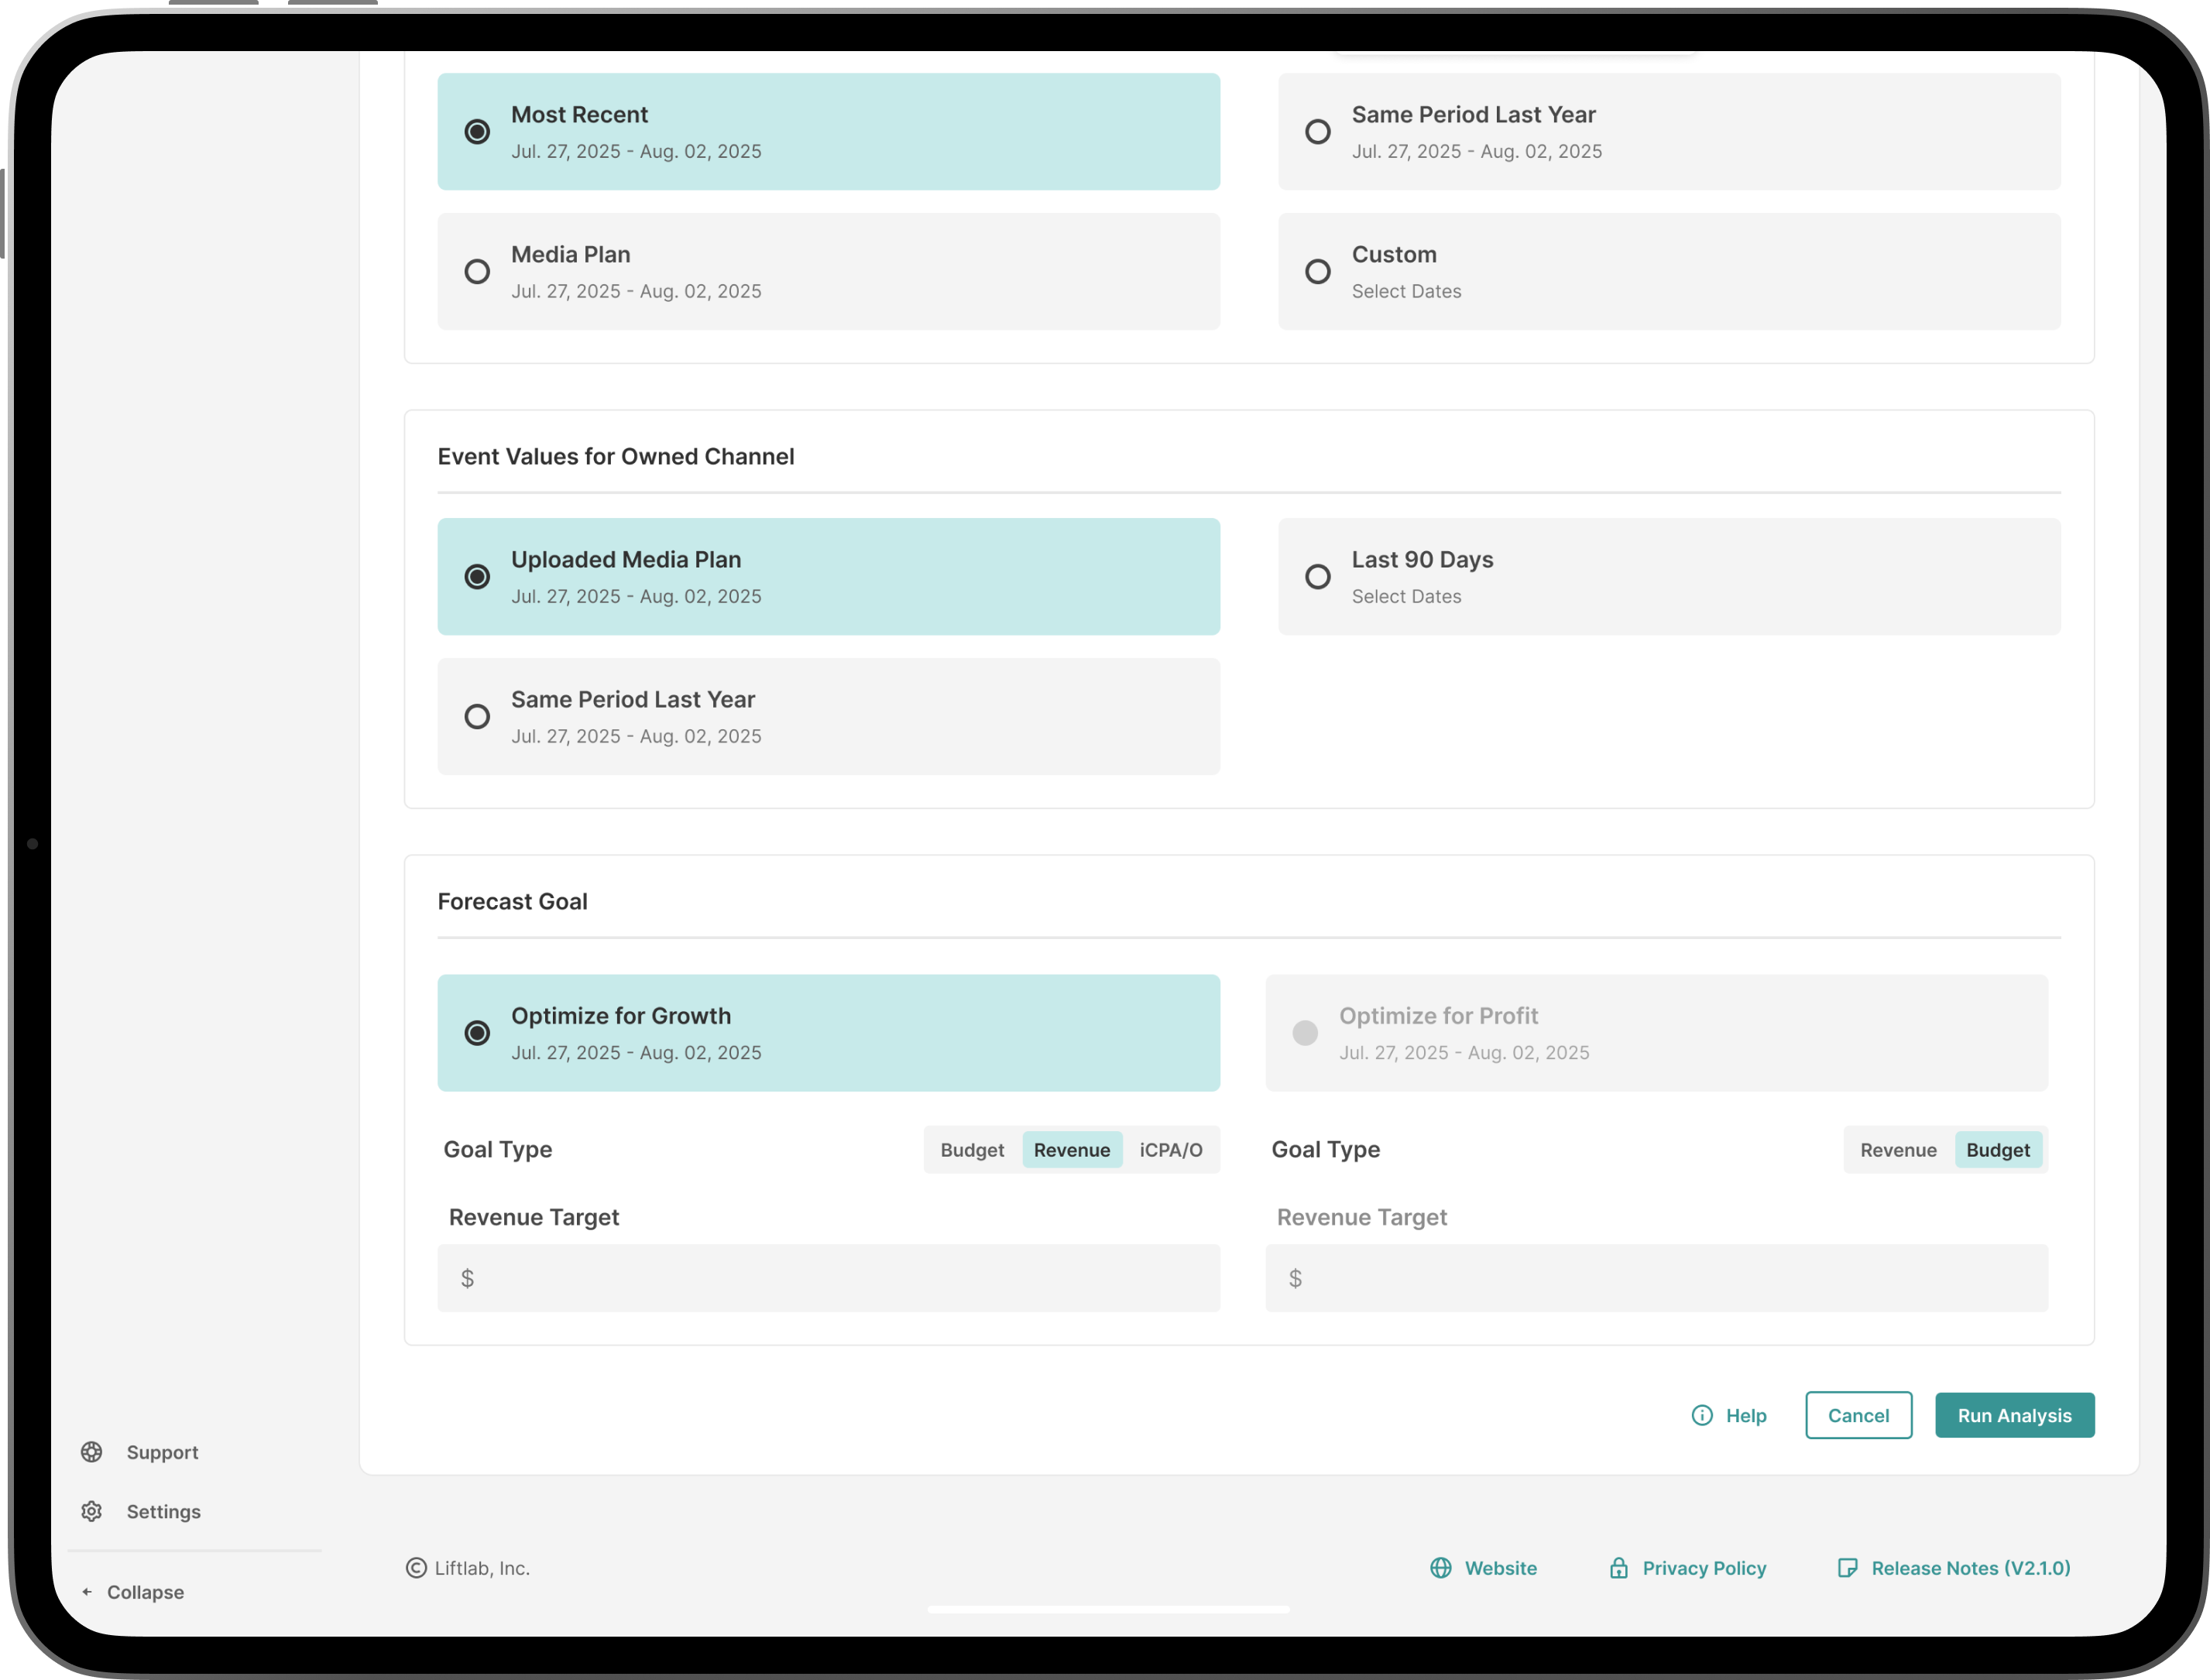
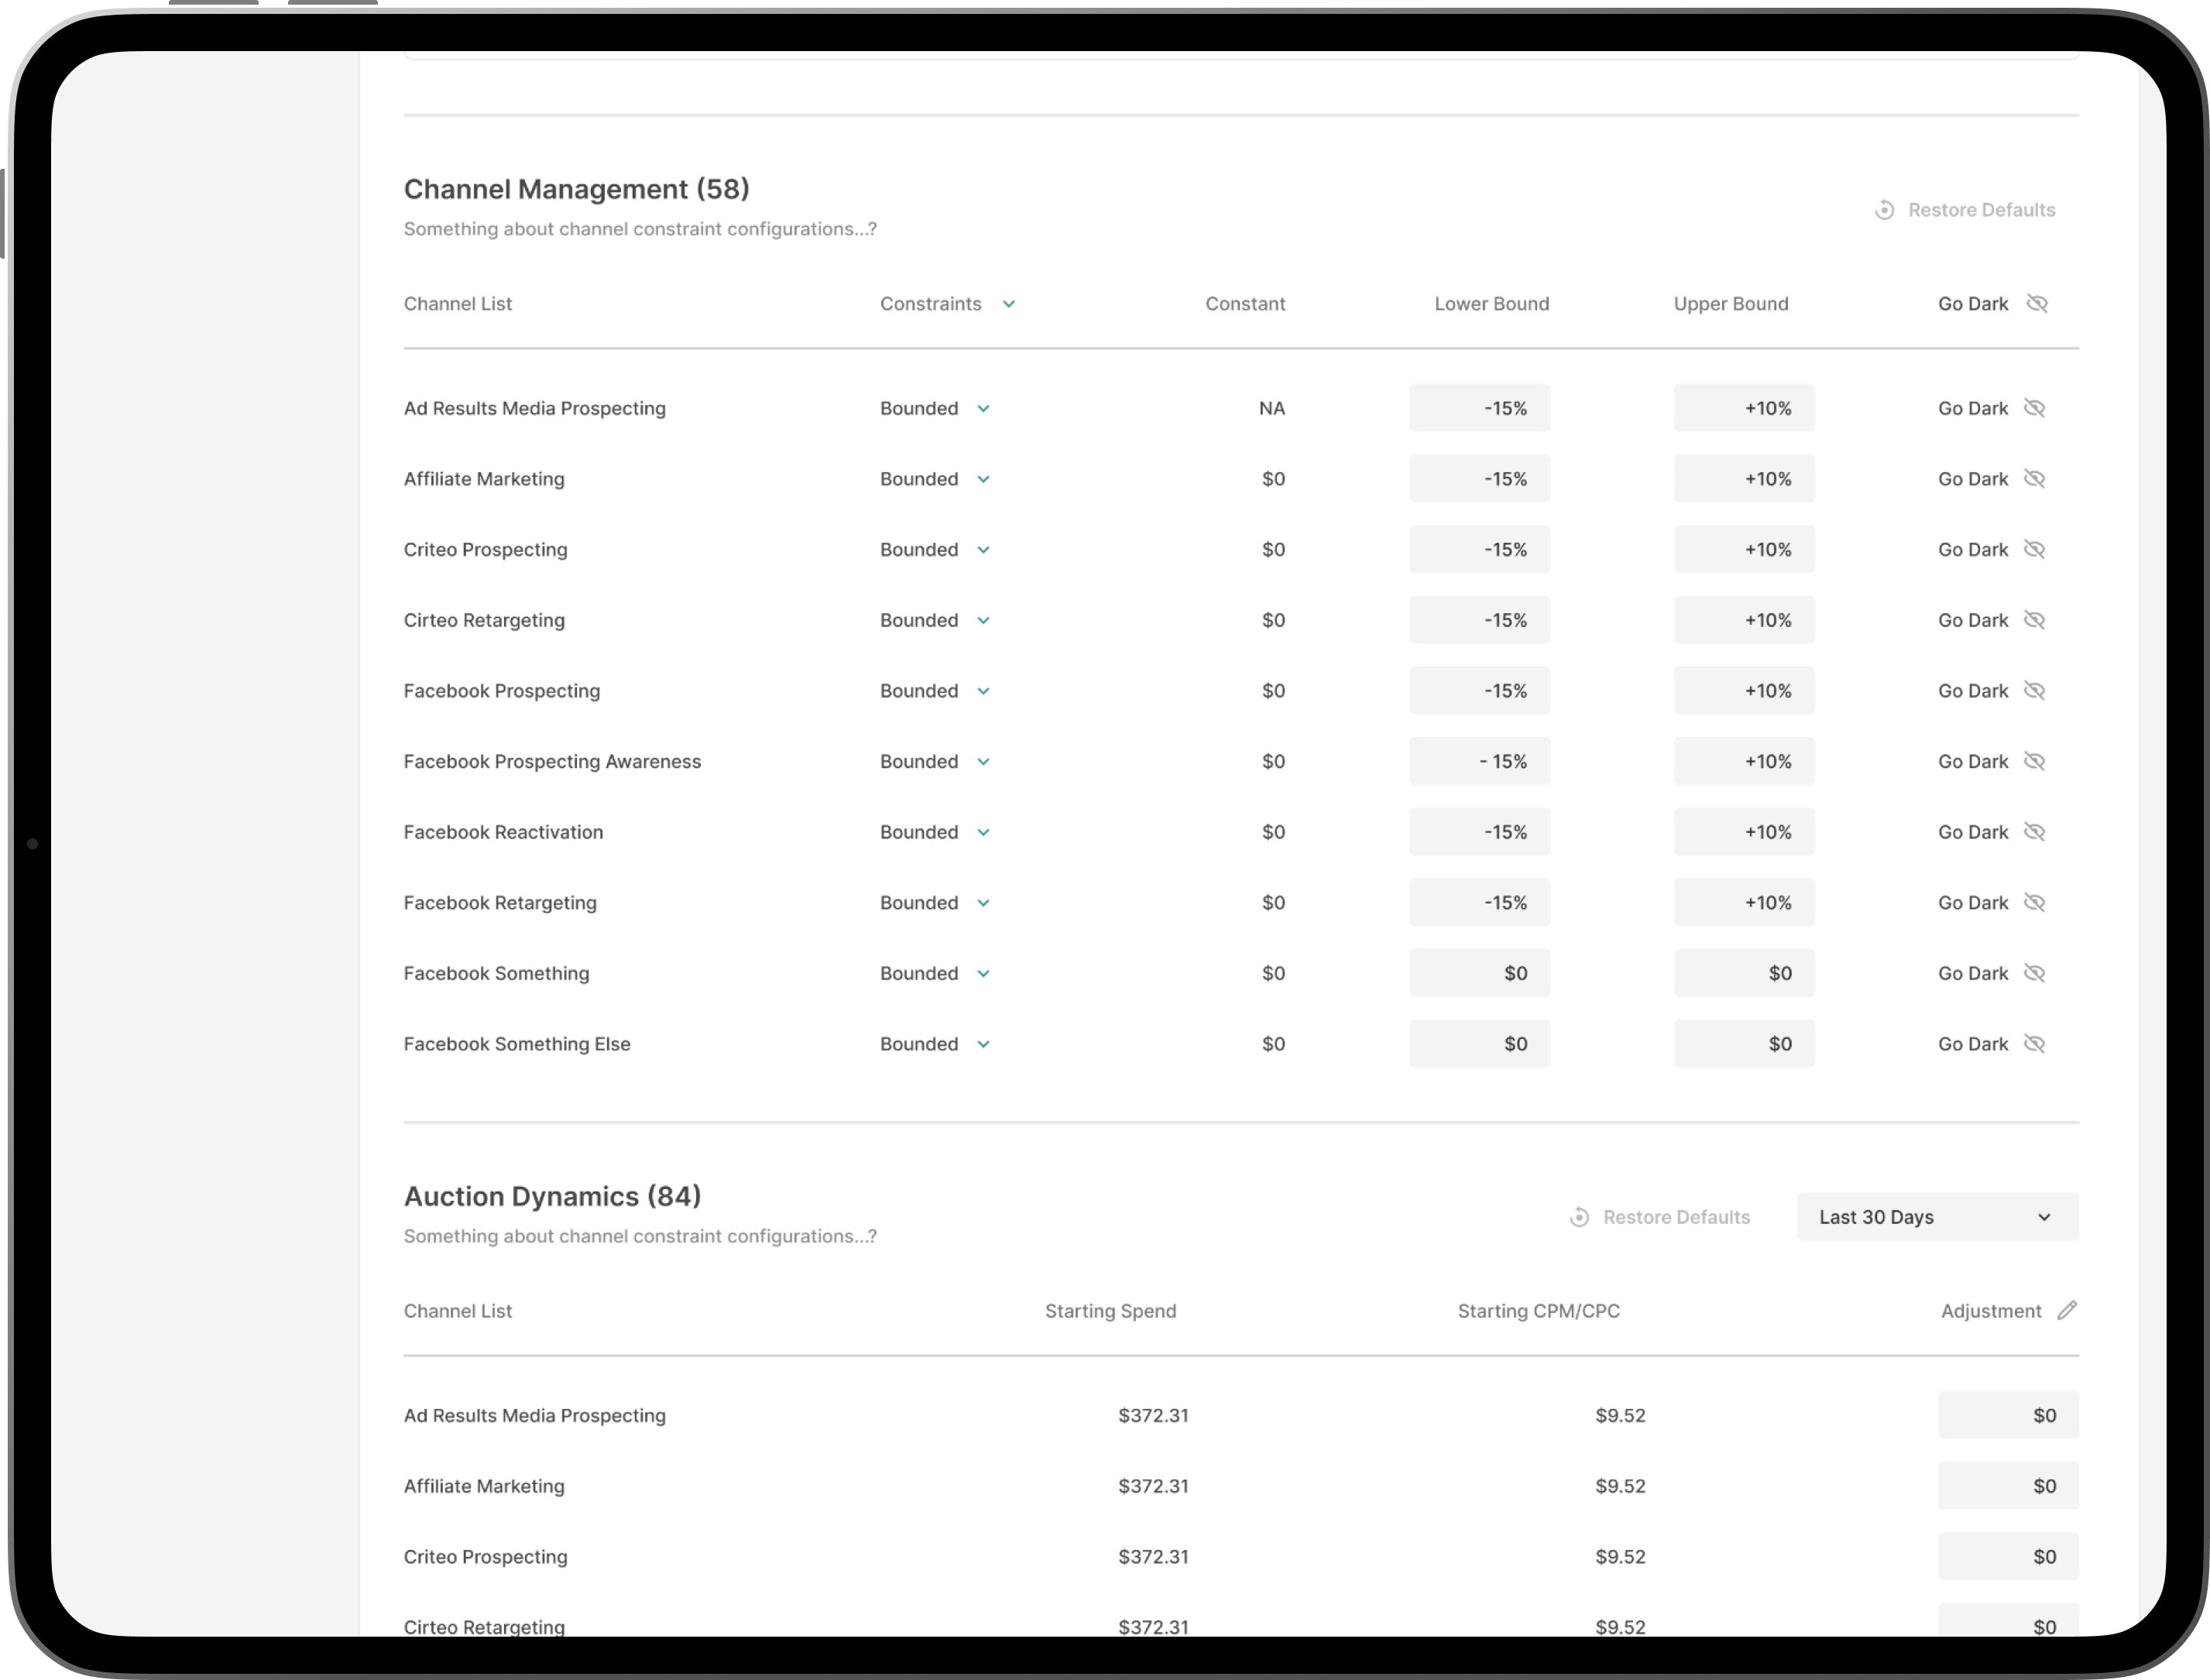
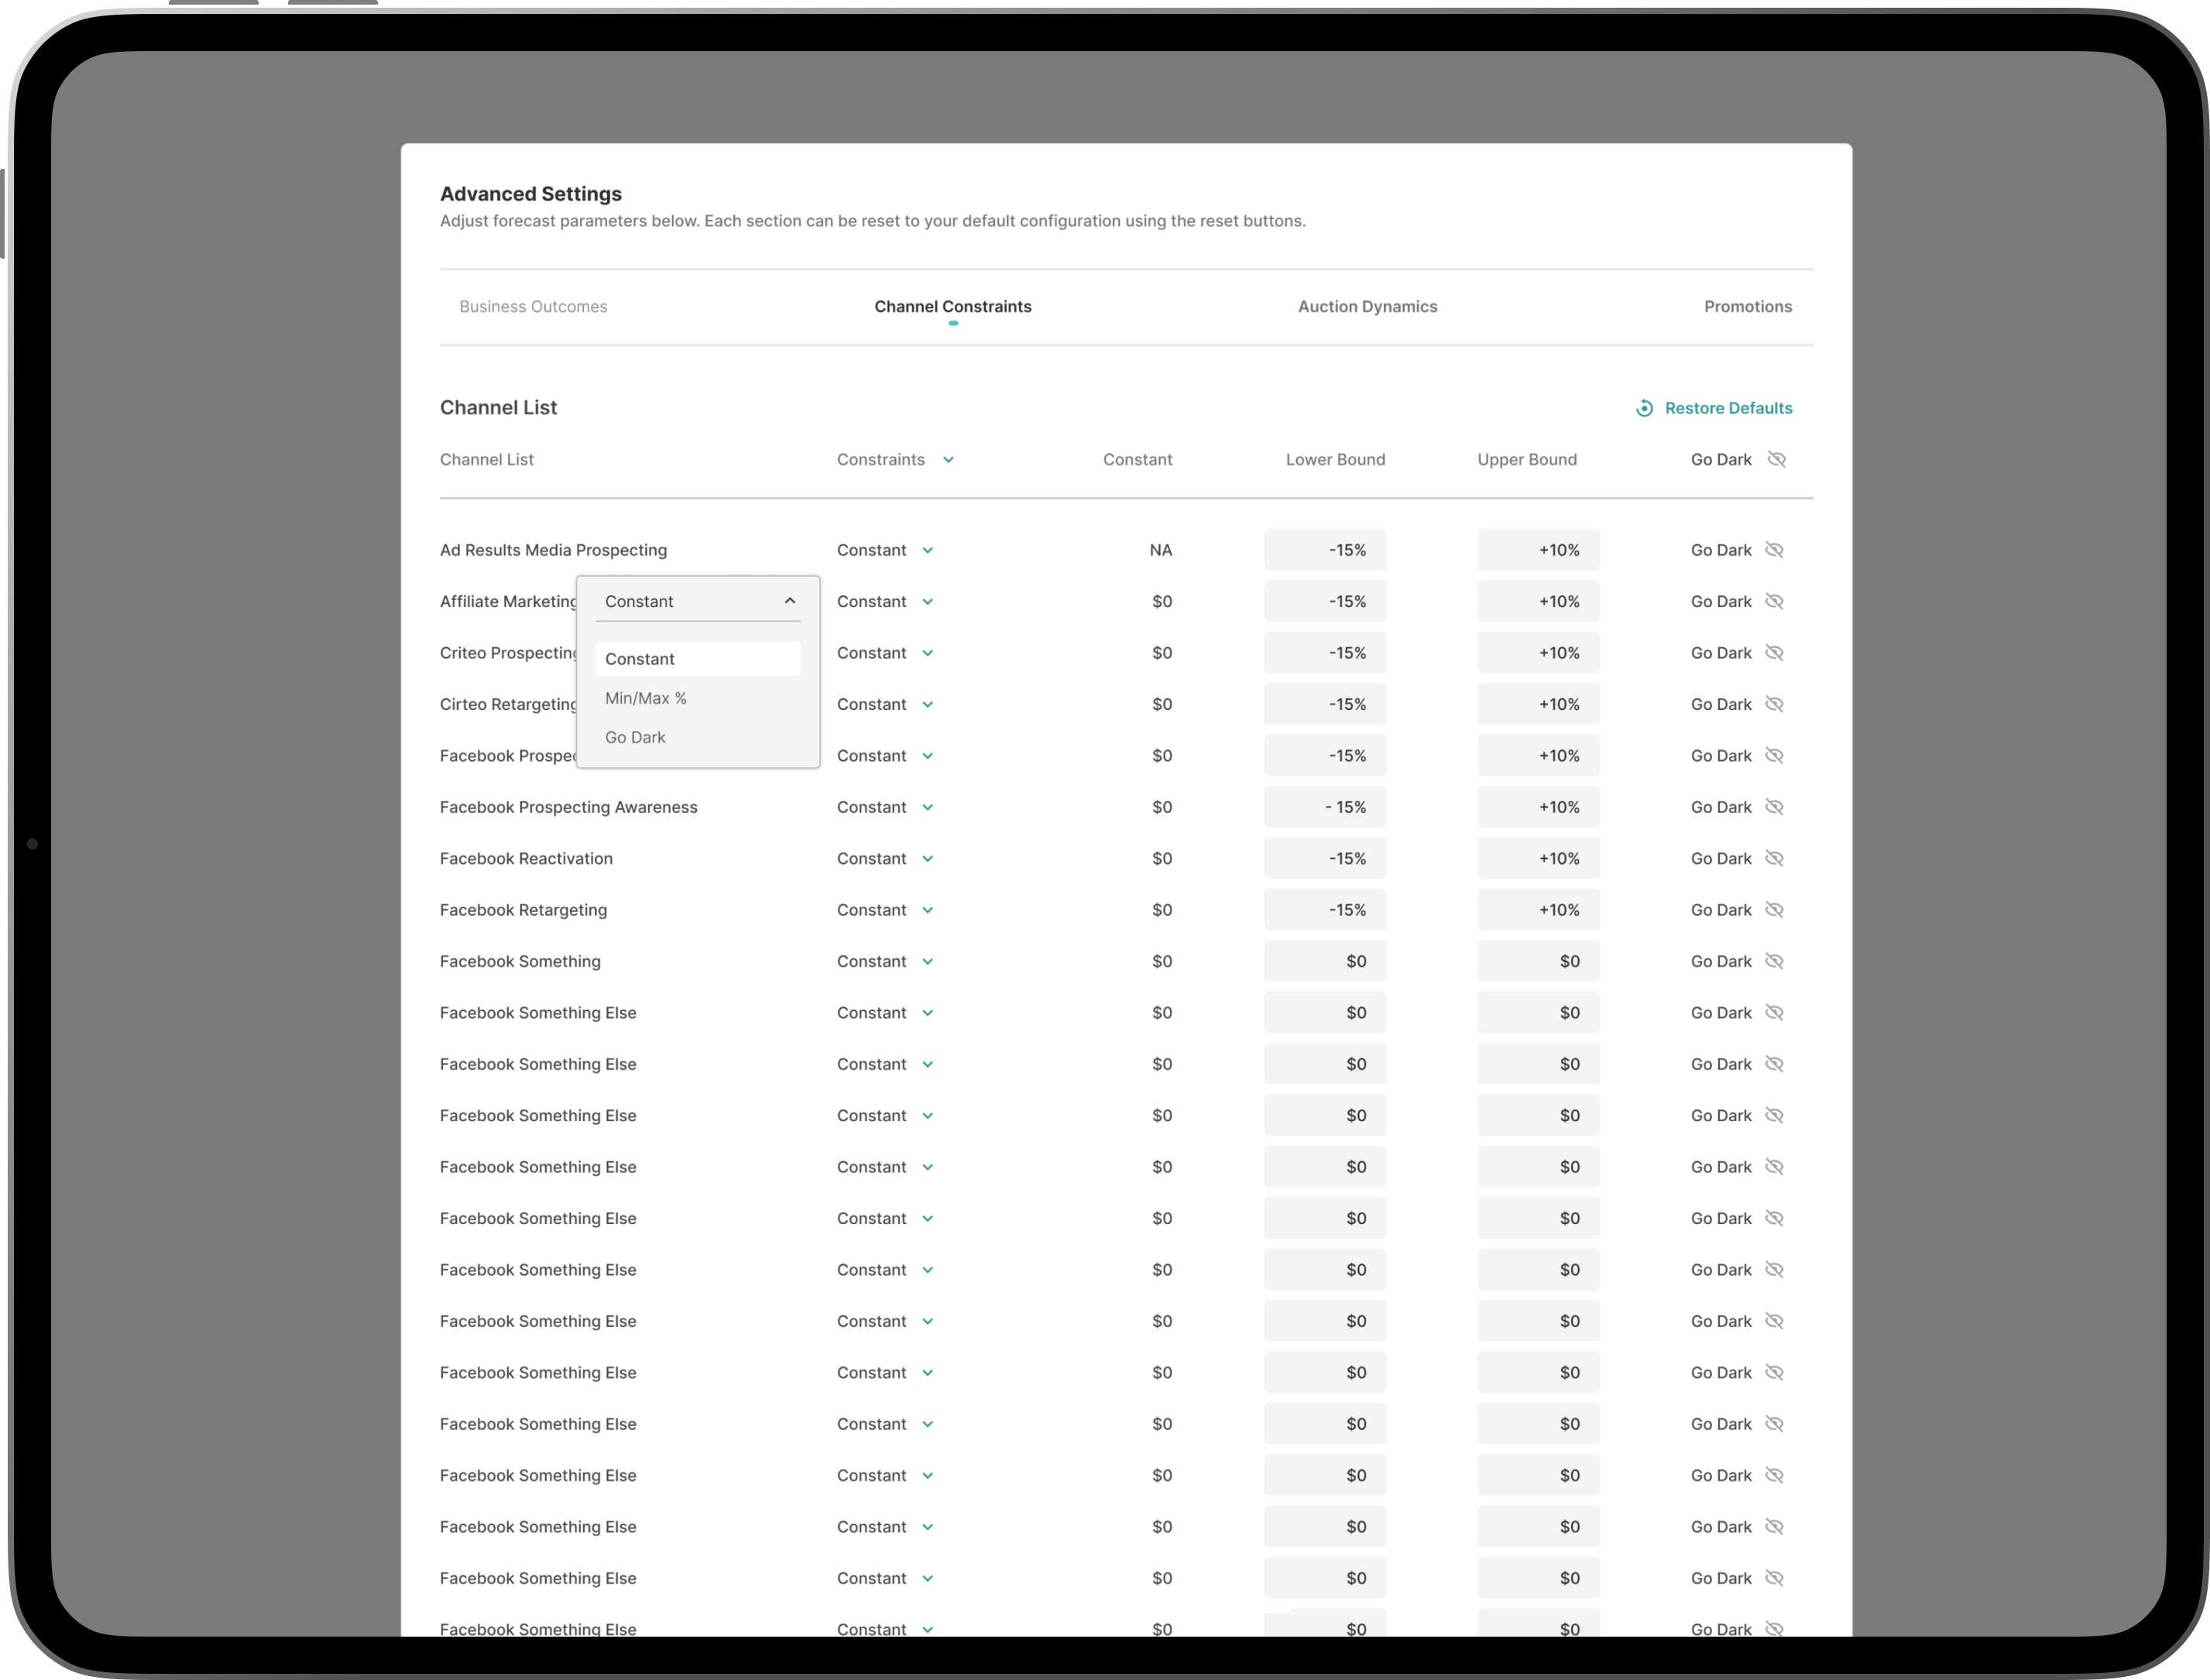
LiftLab: Full Funnel Media Marketing Budgeting and Forecasting

Project Overview

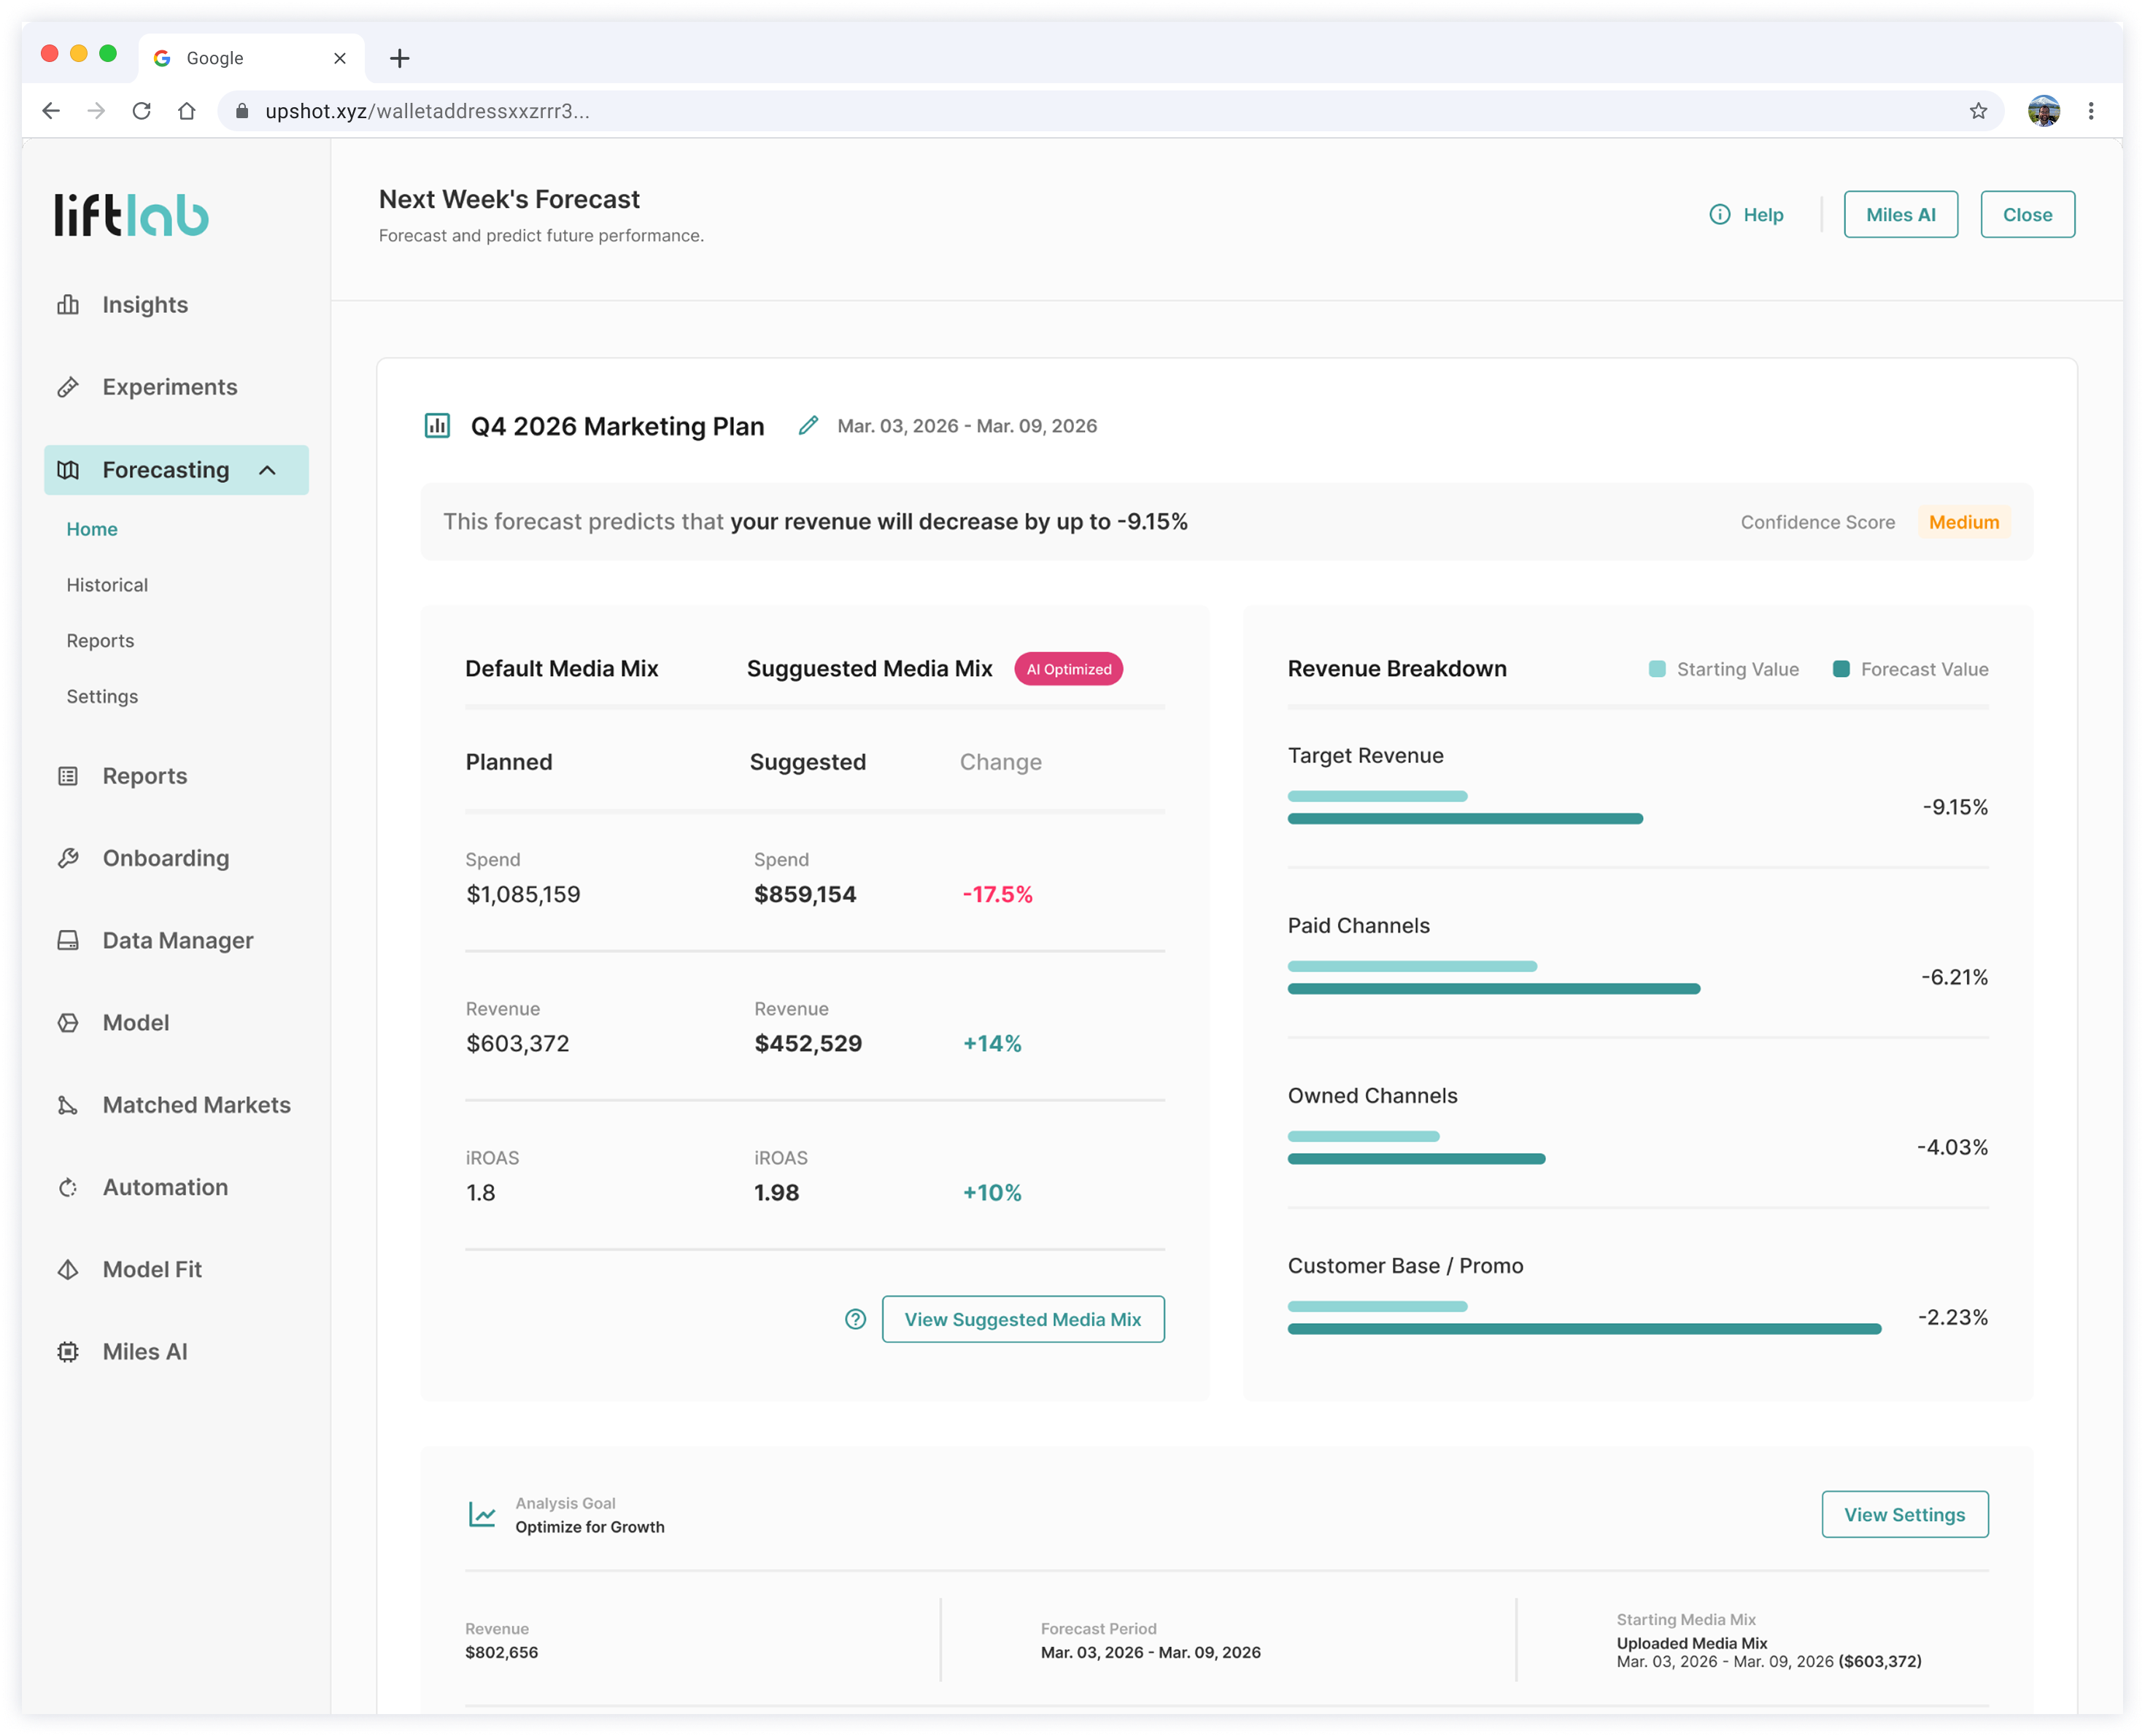
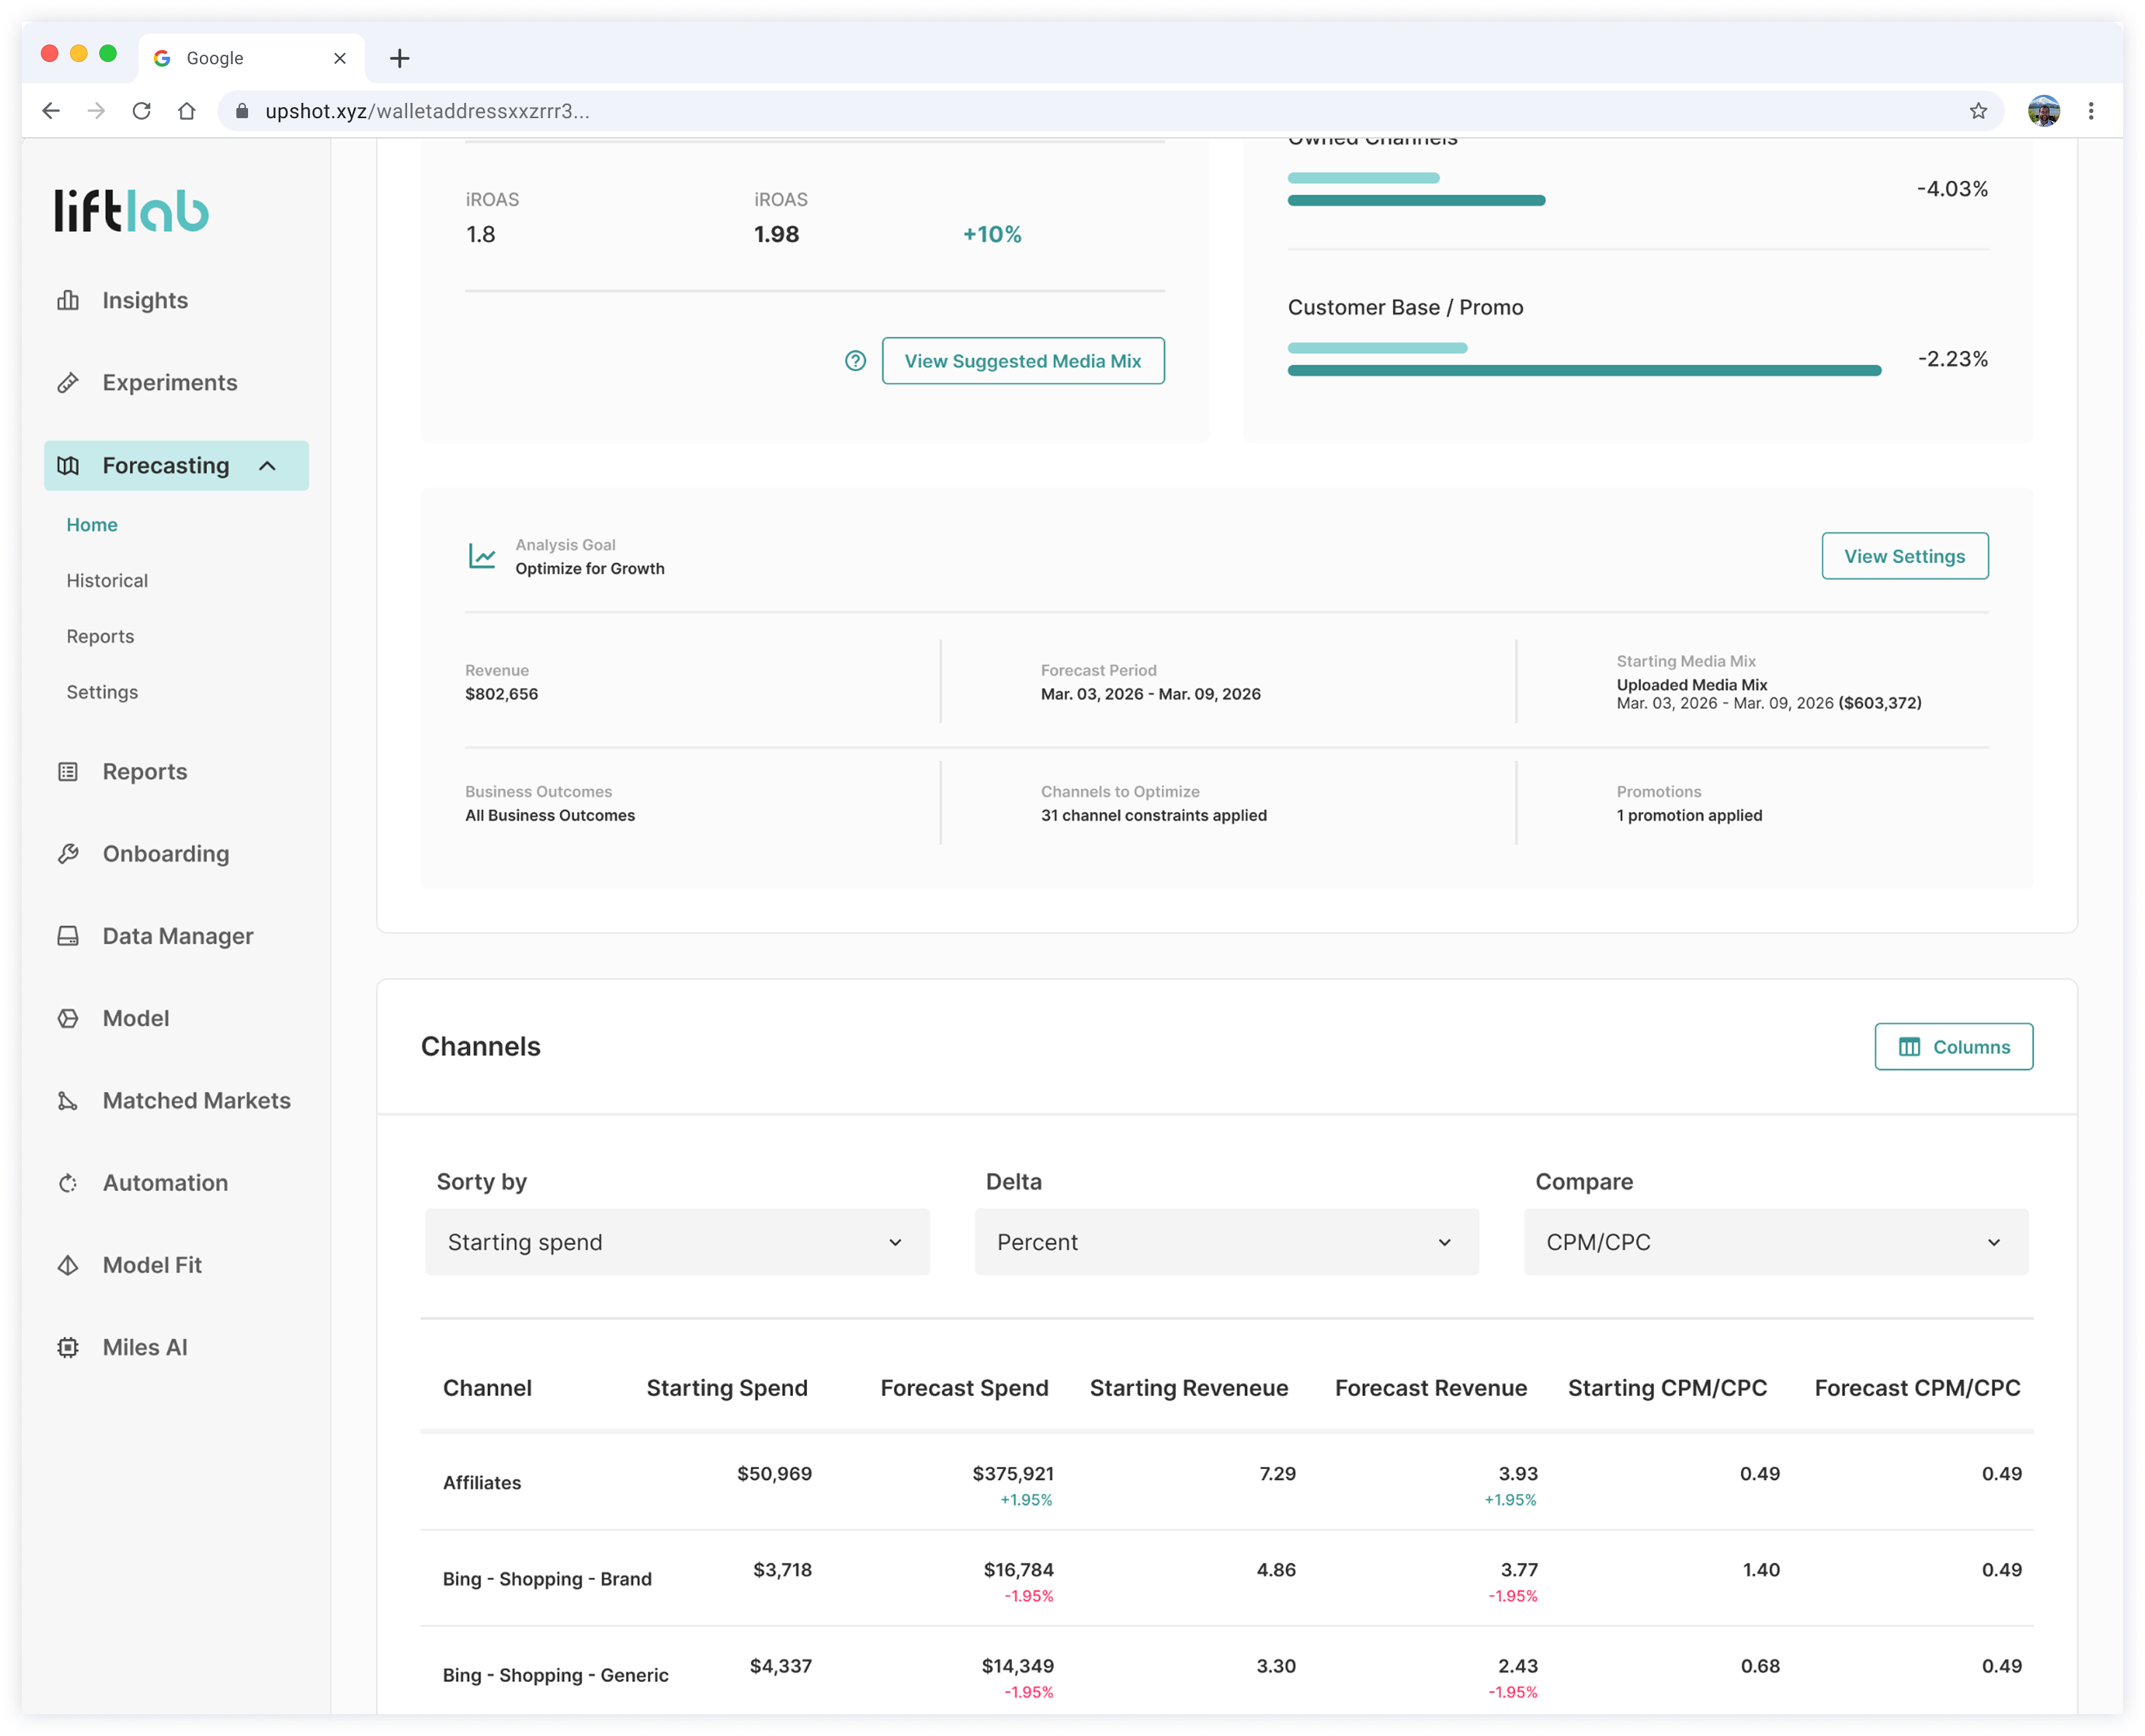
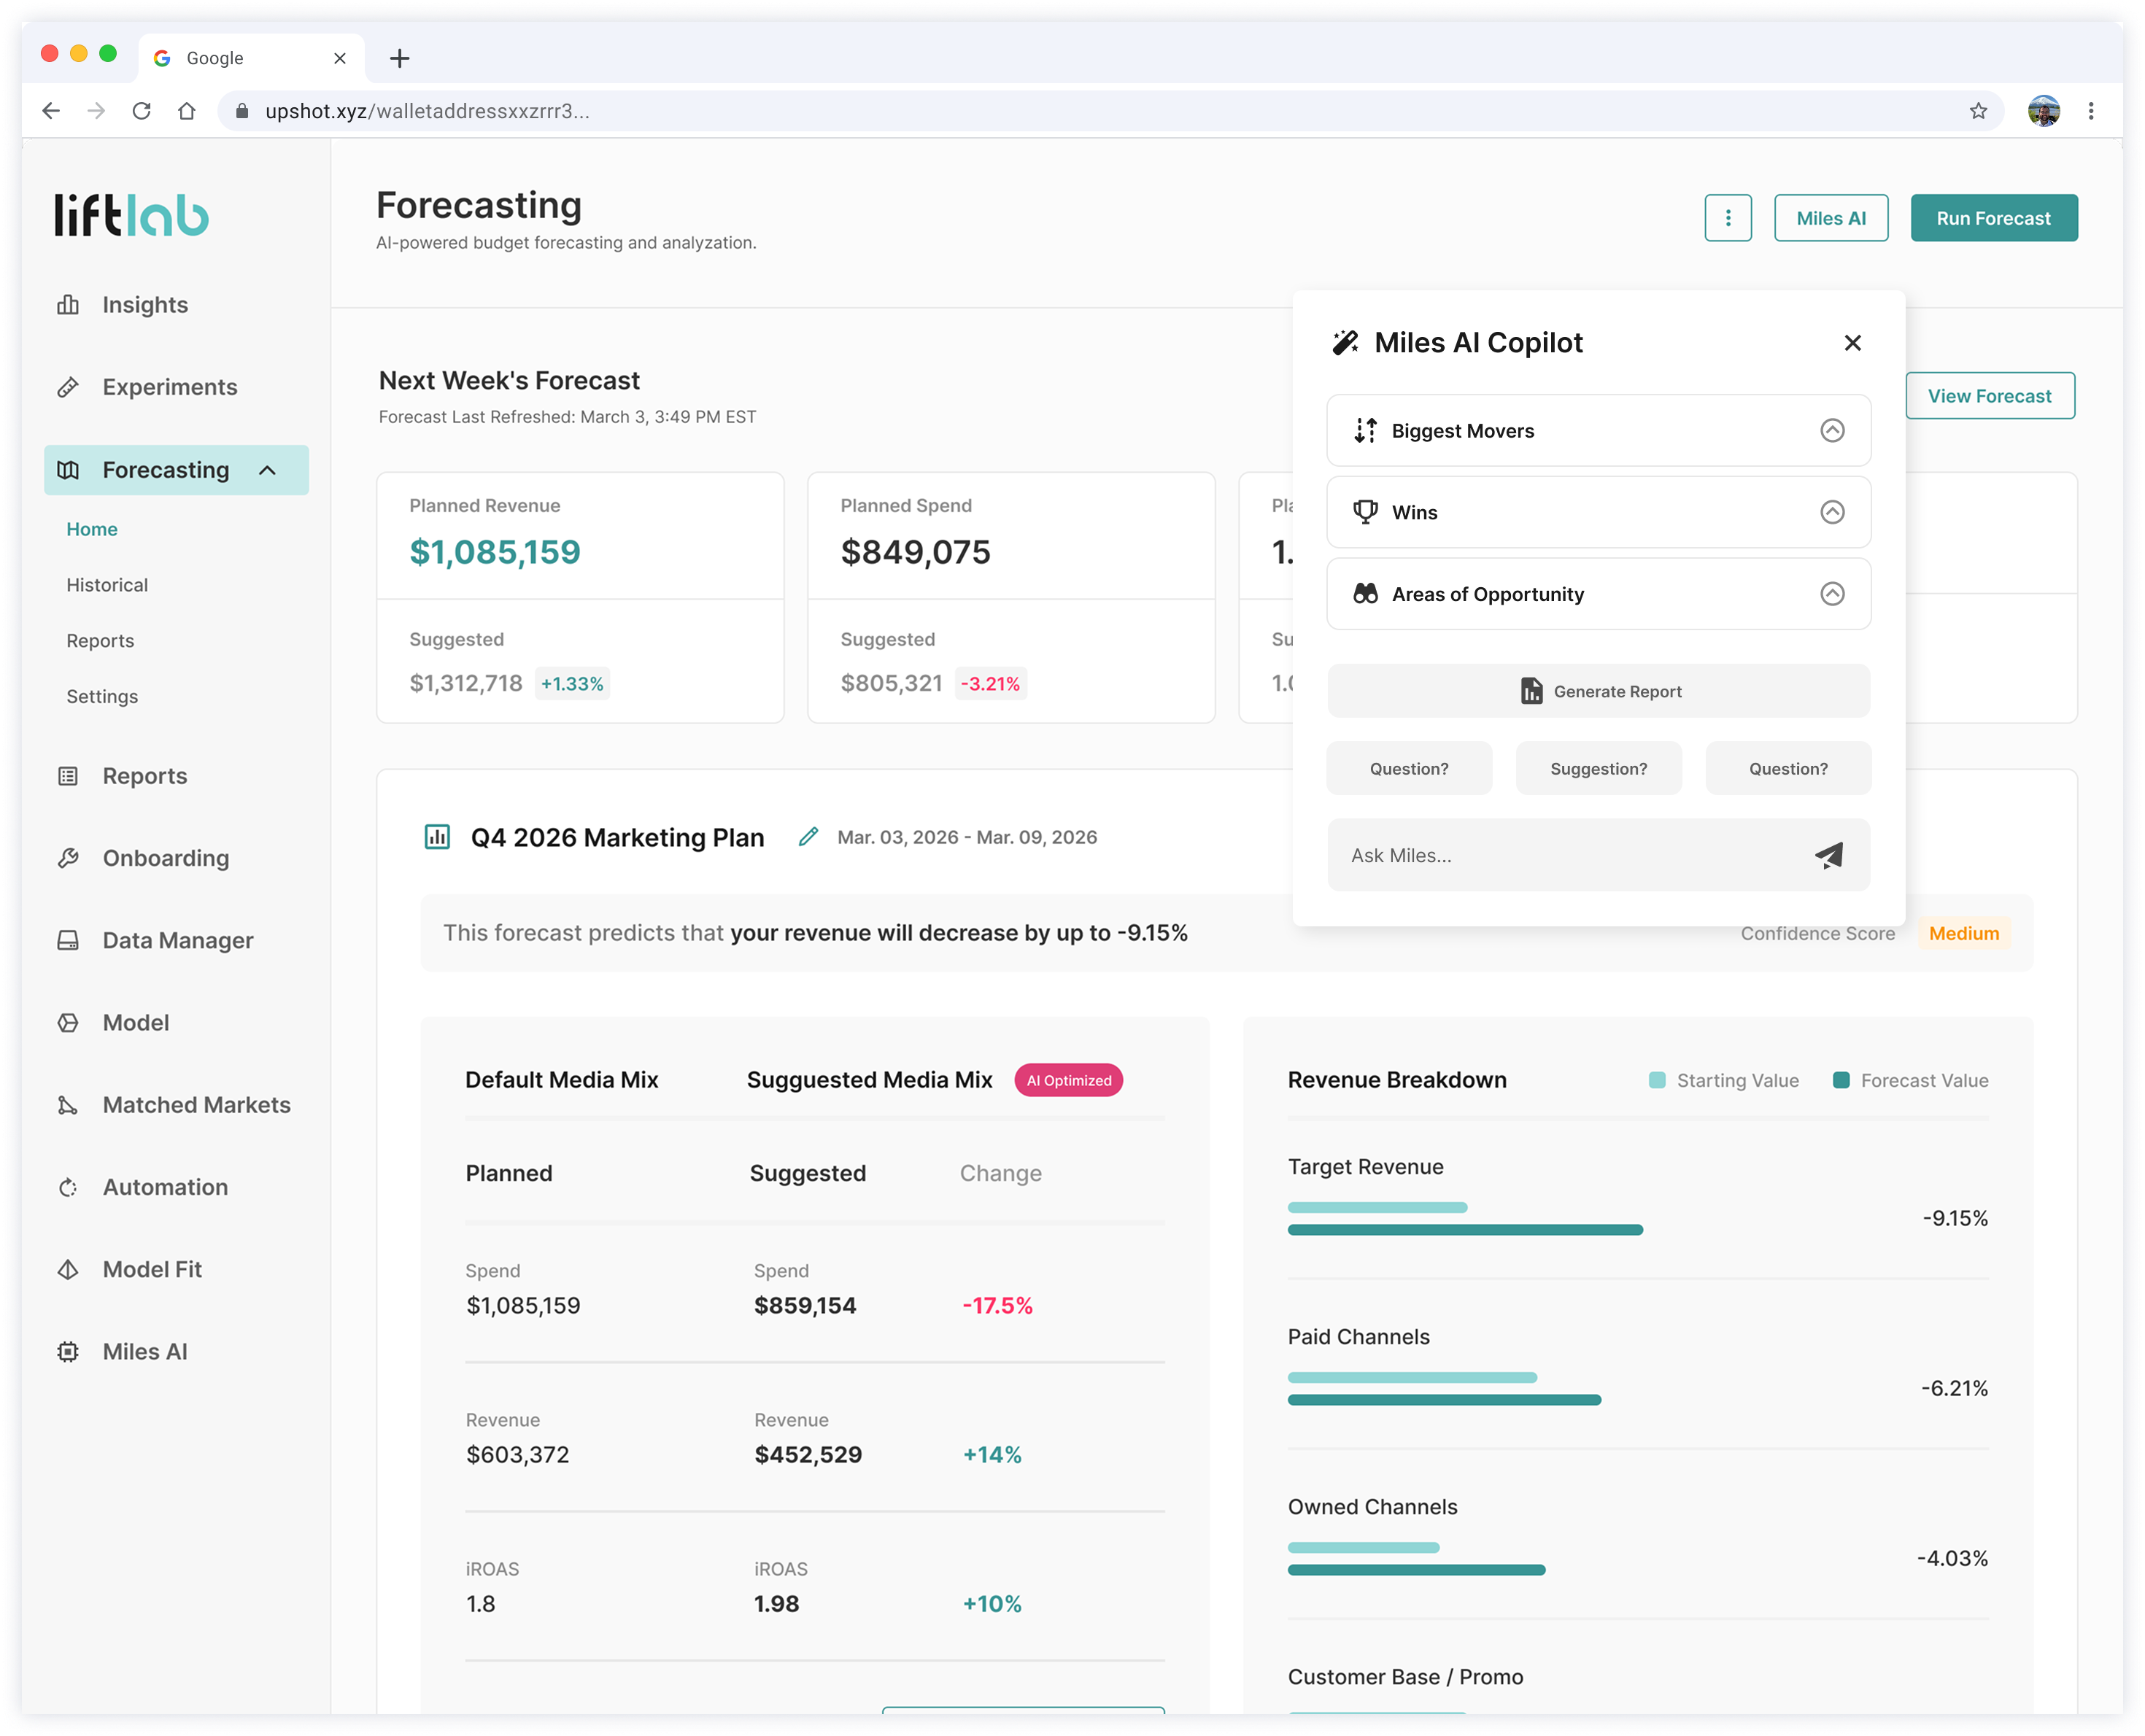
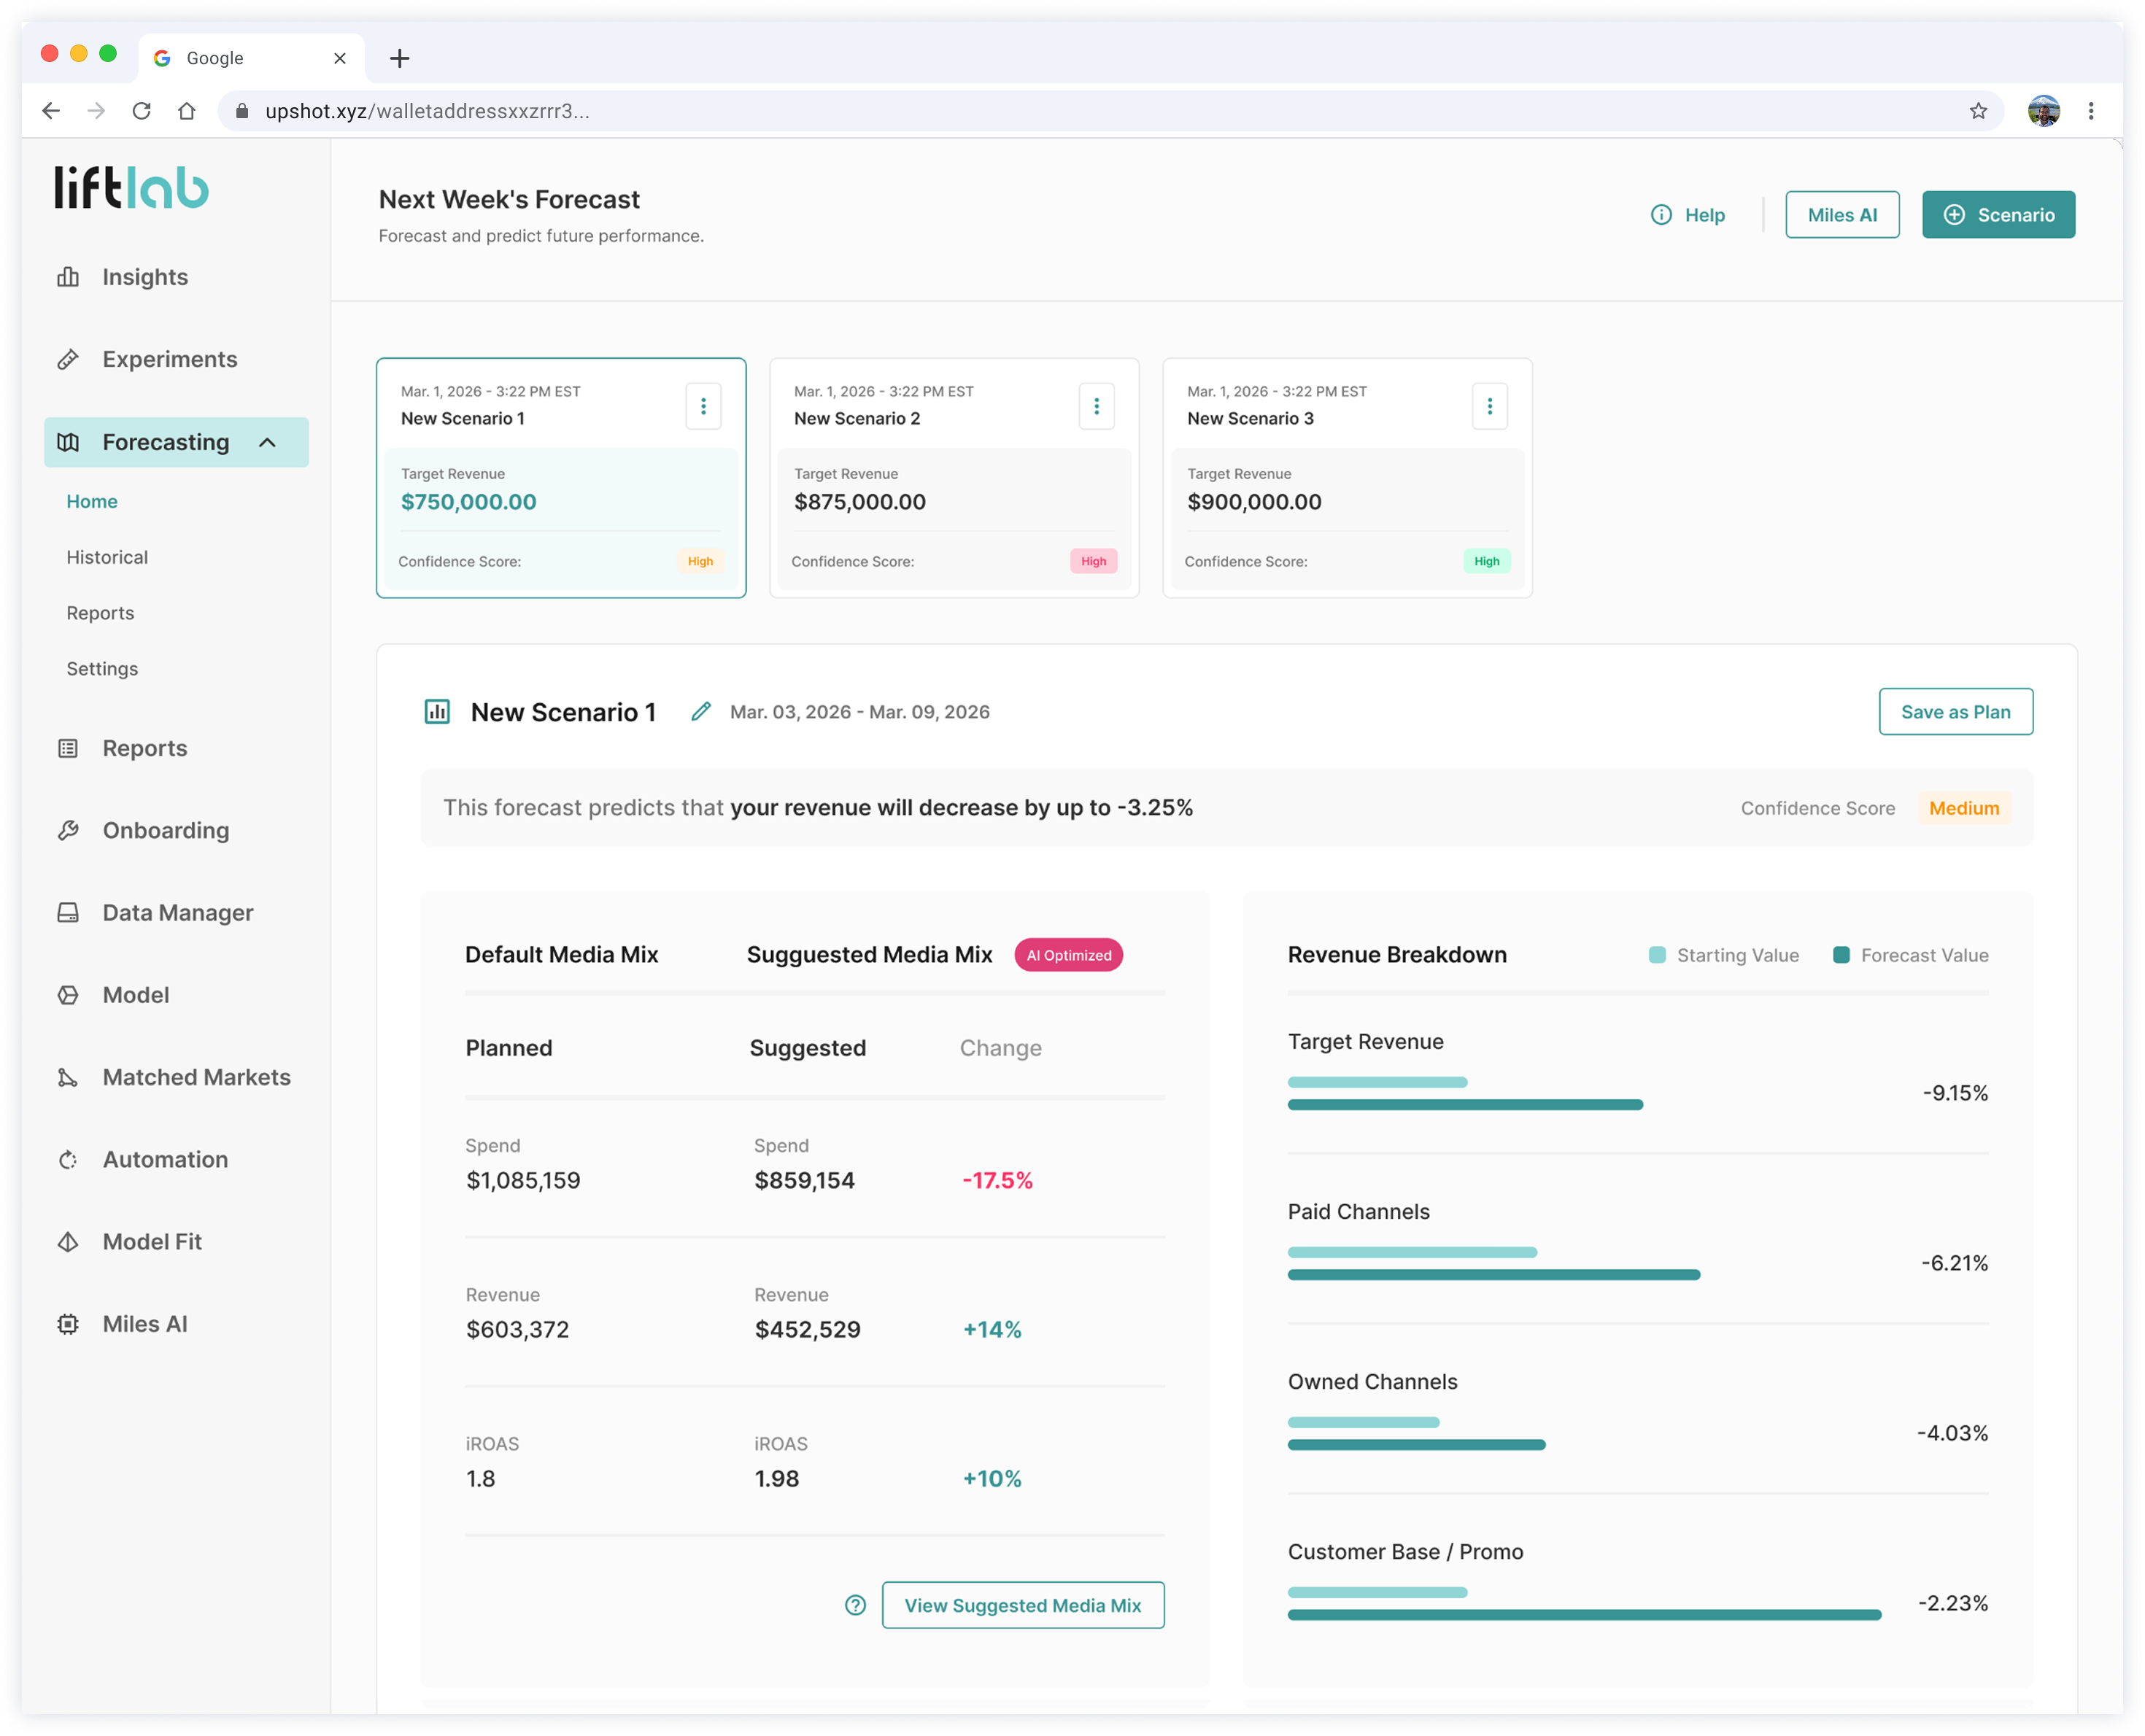
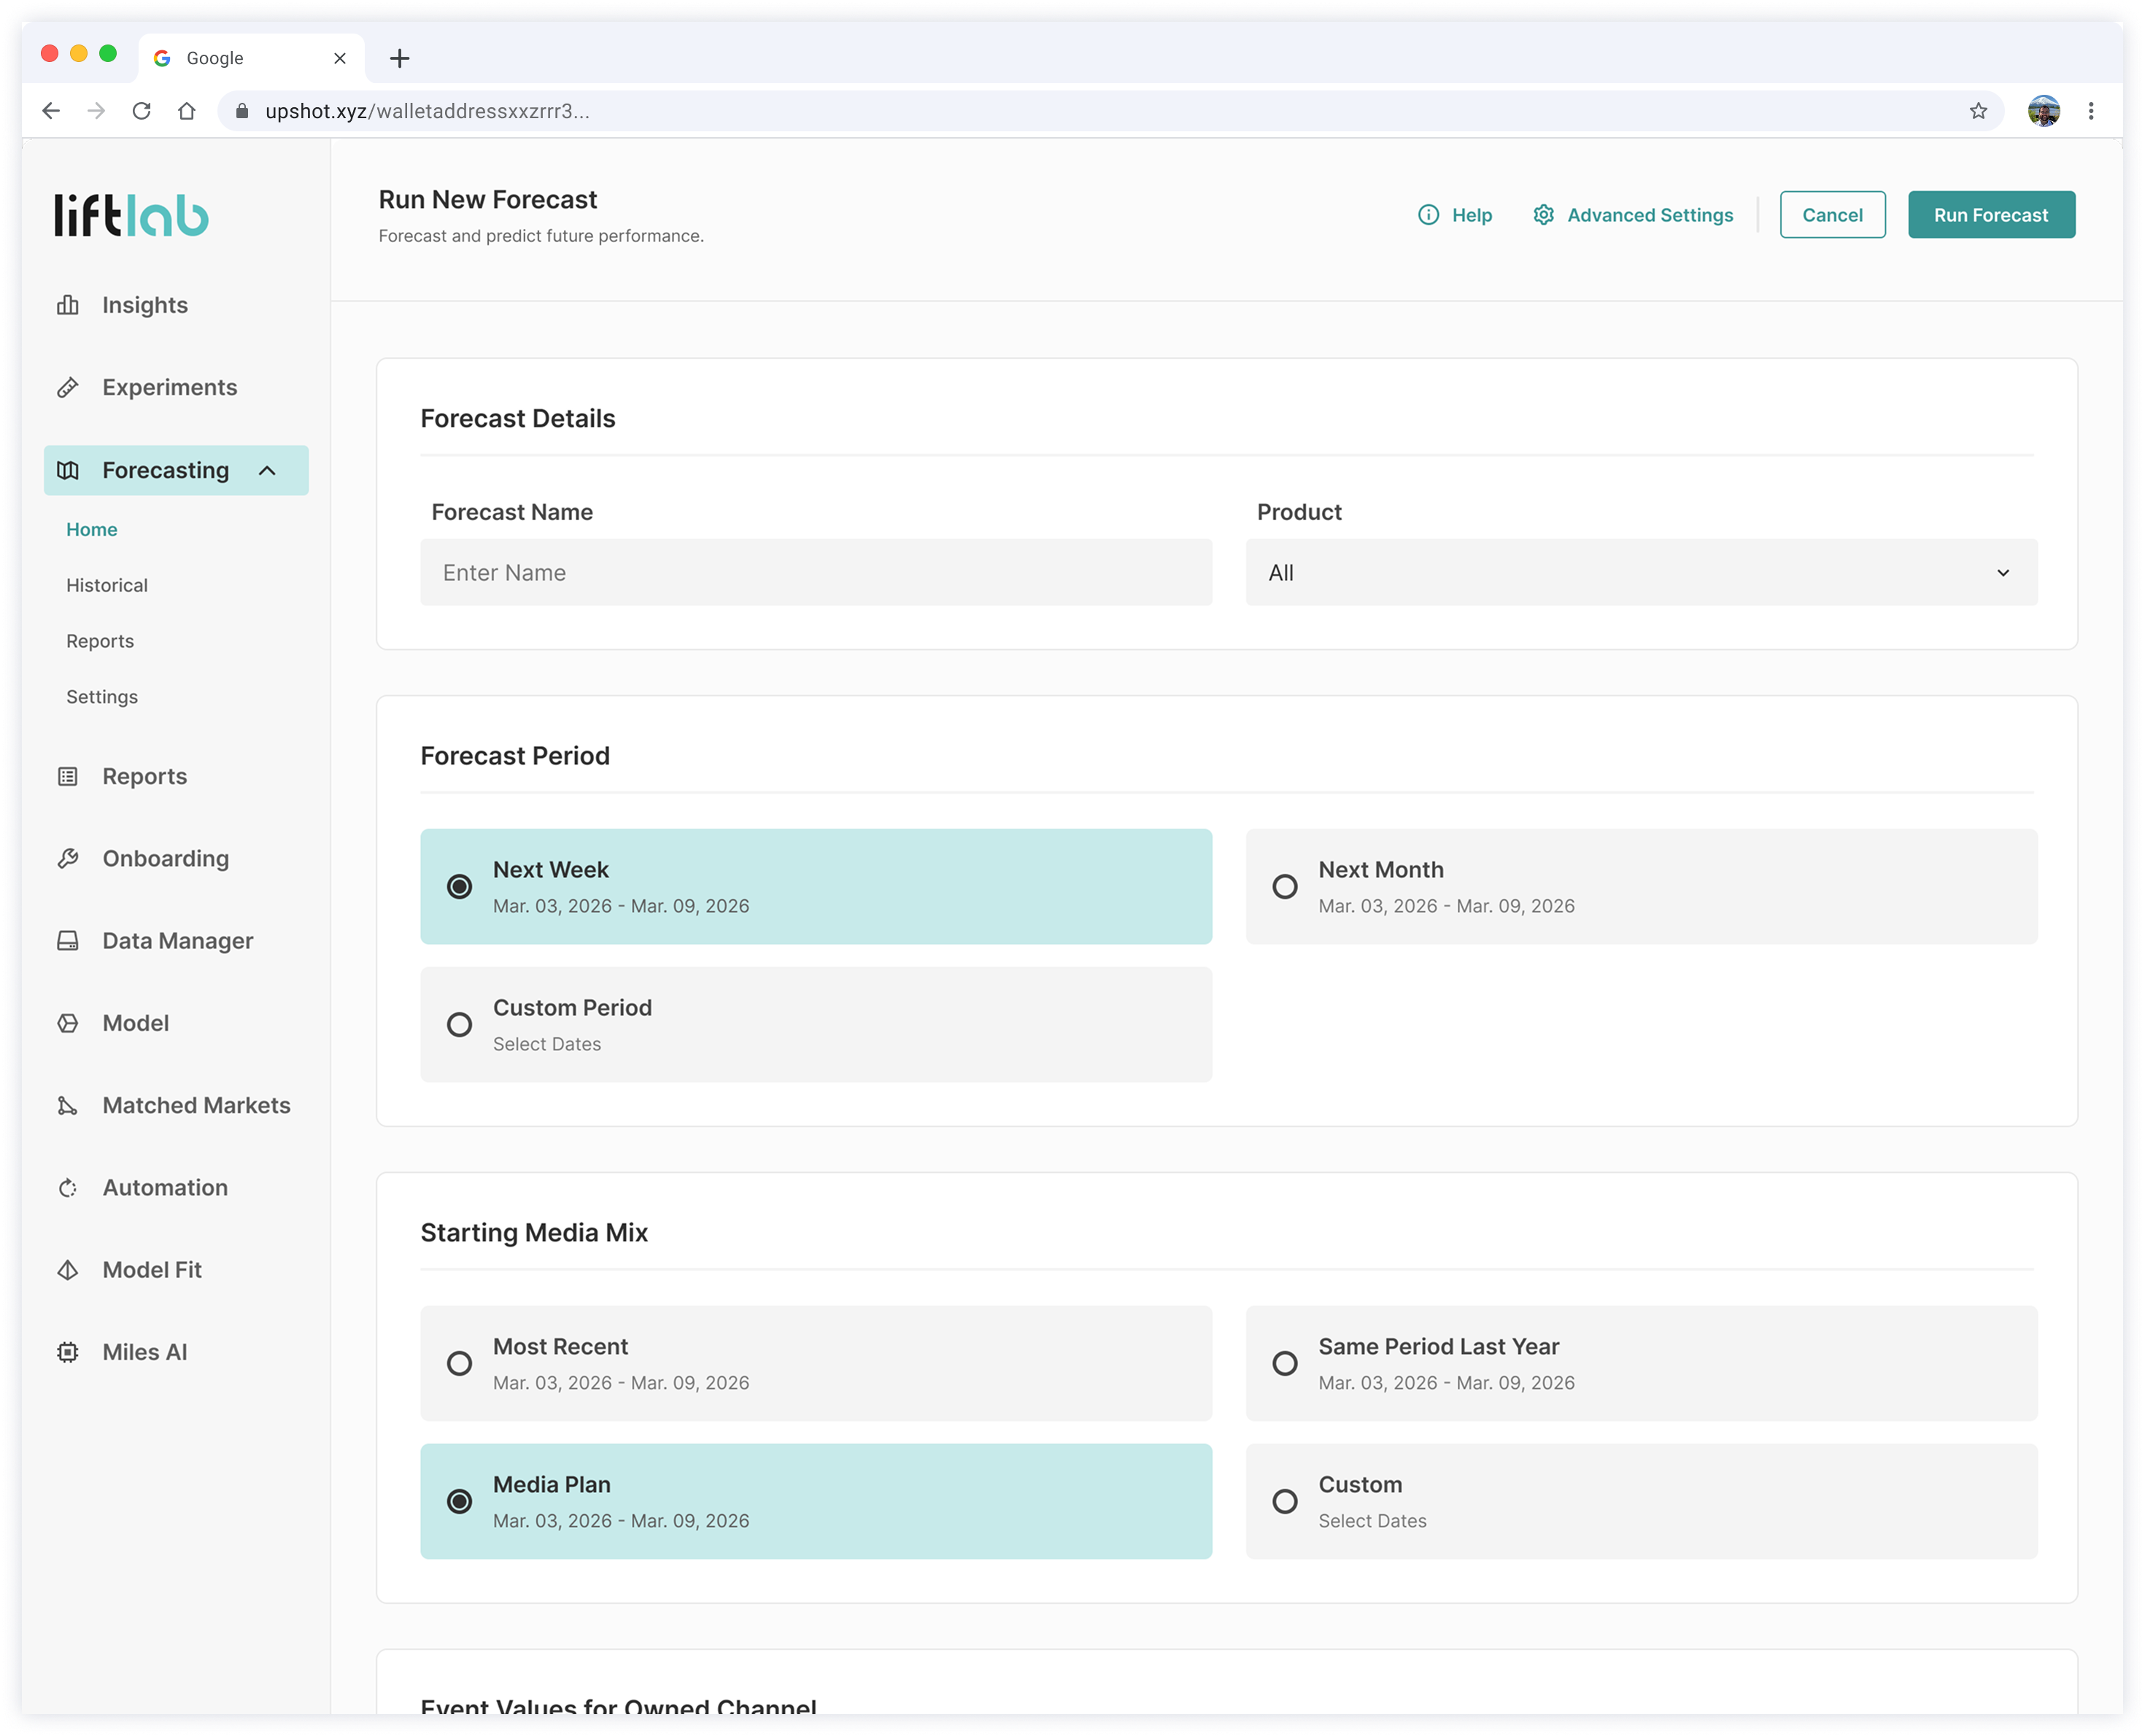
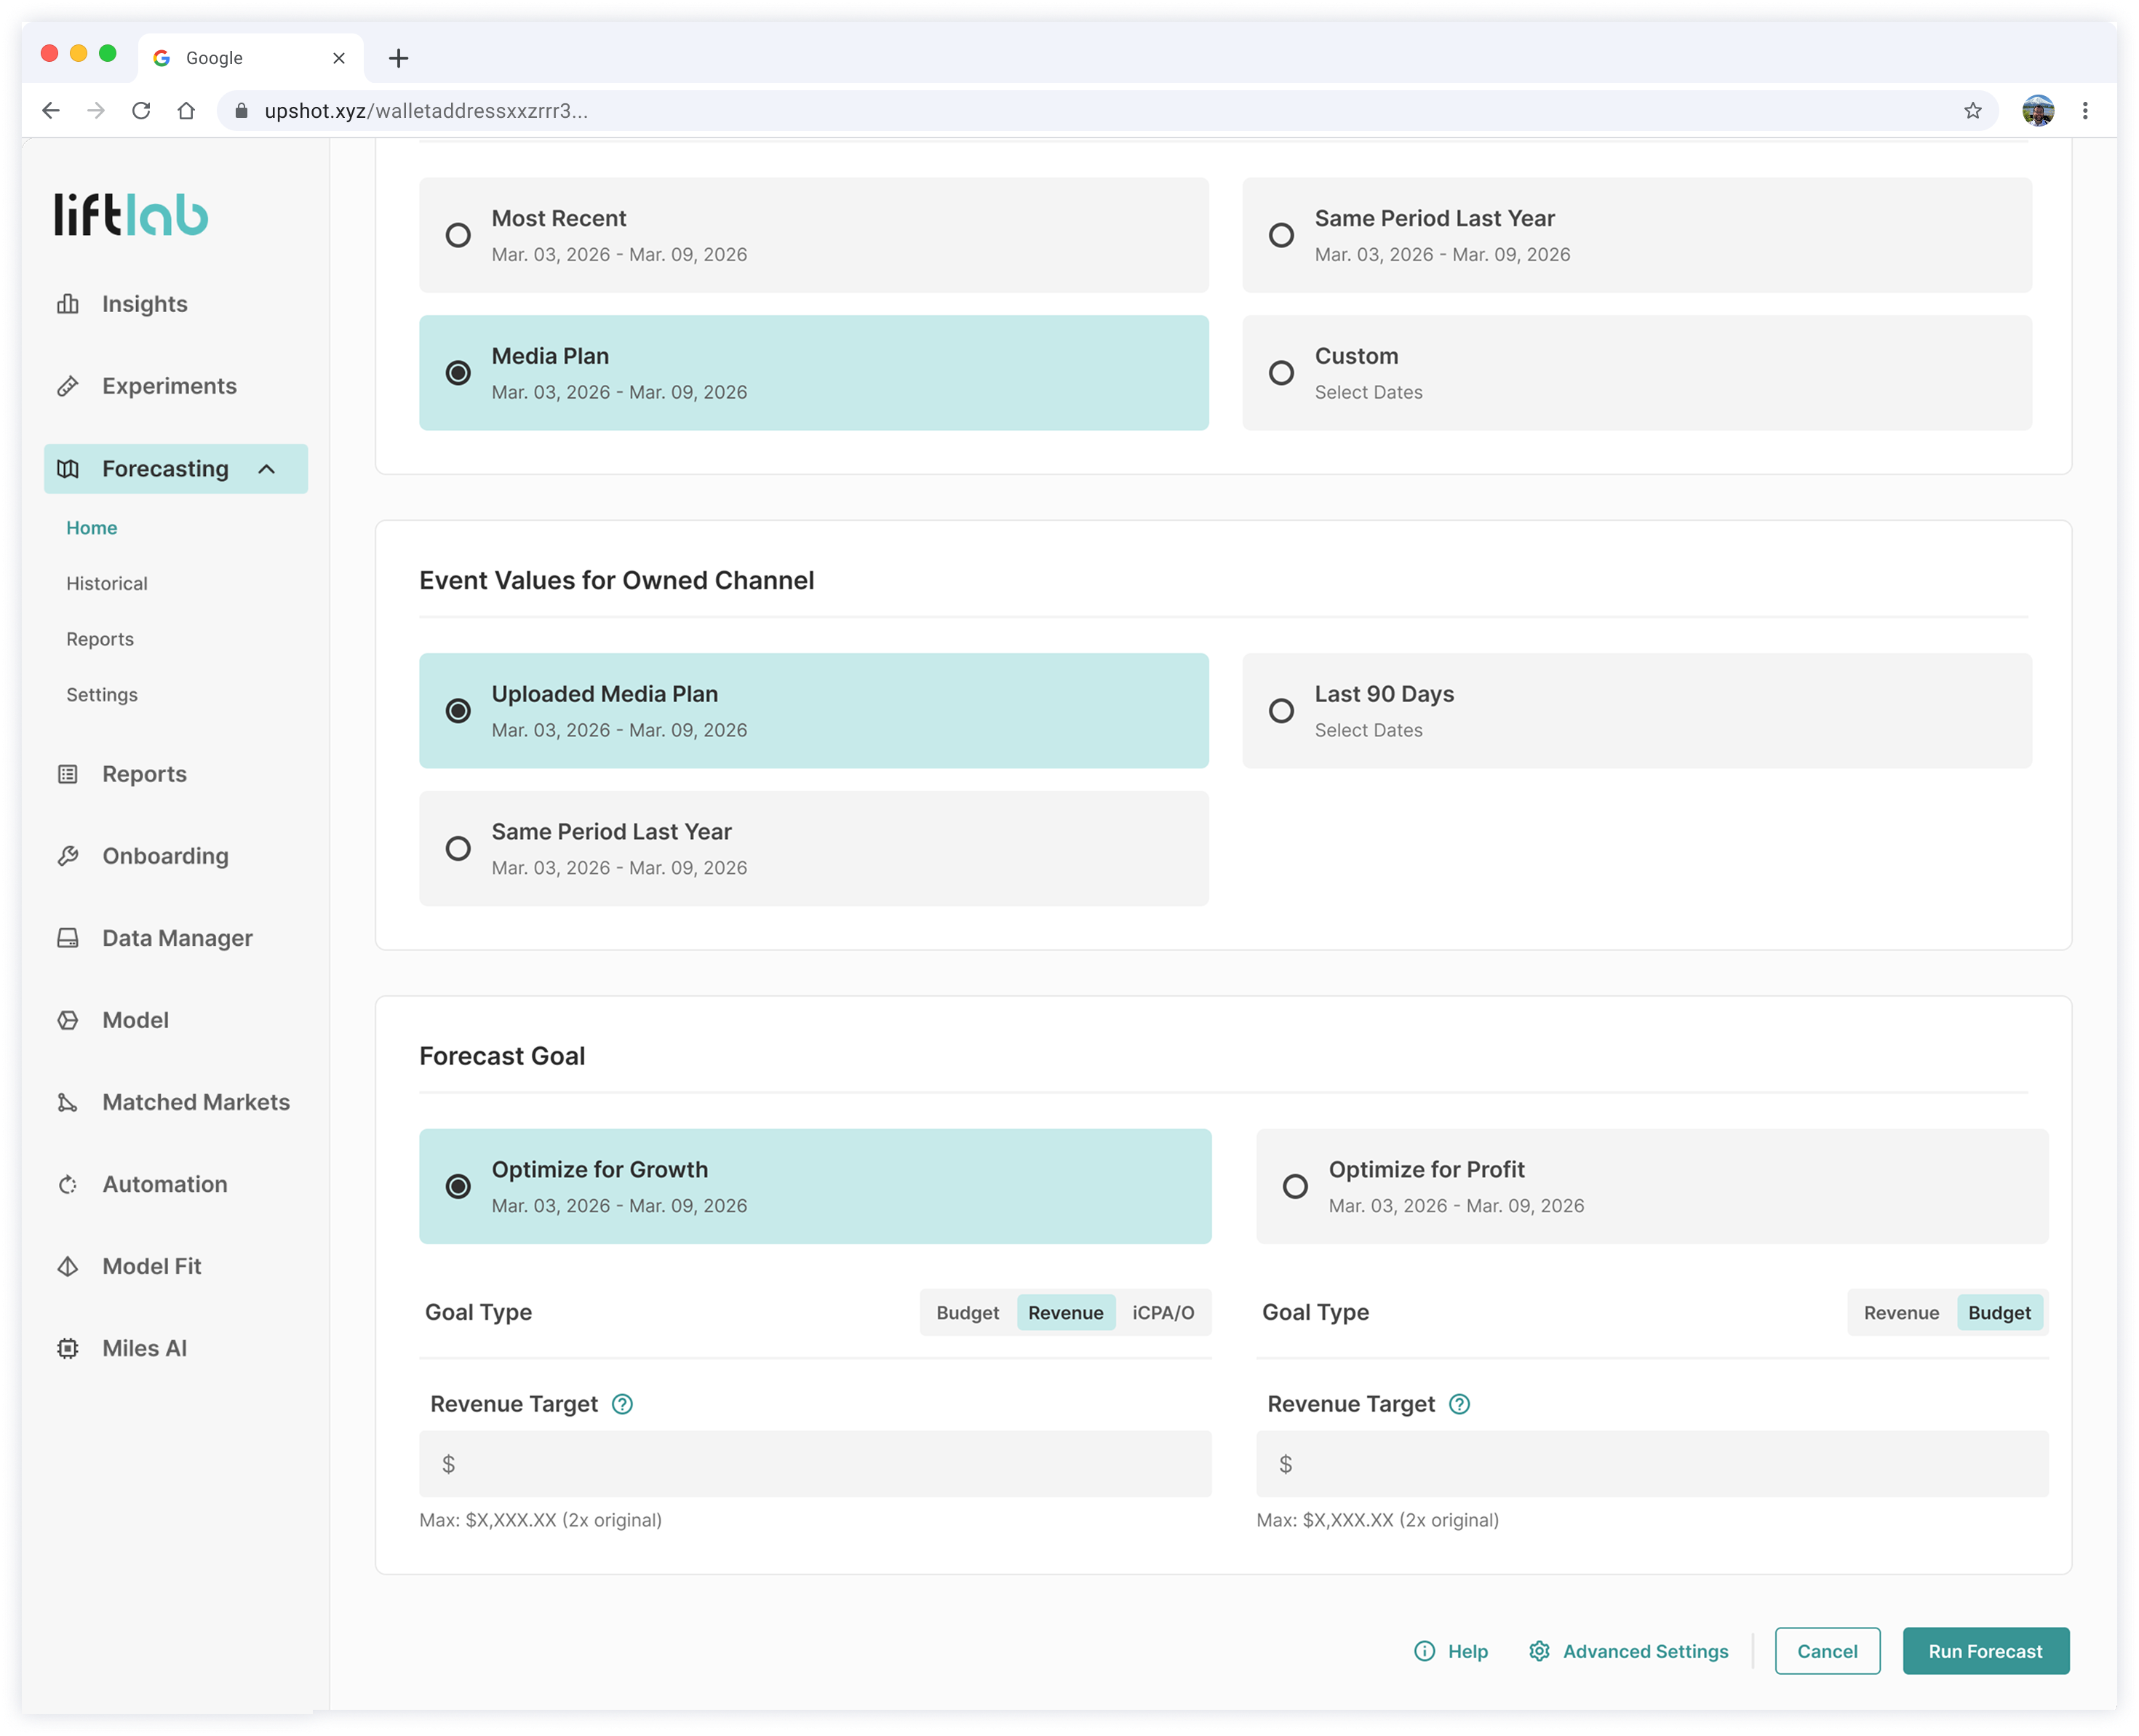
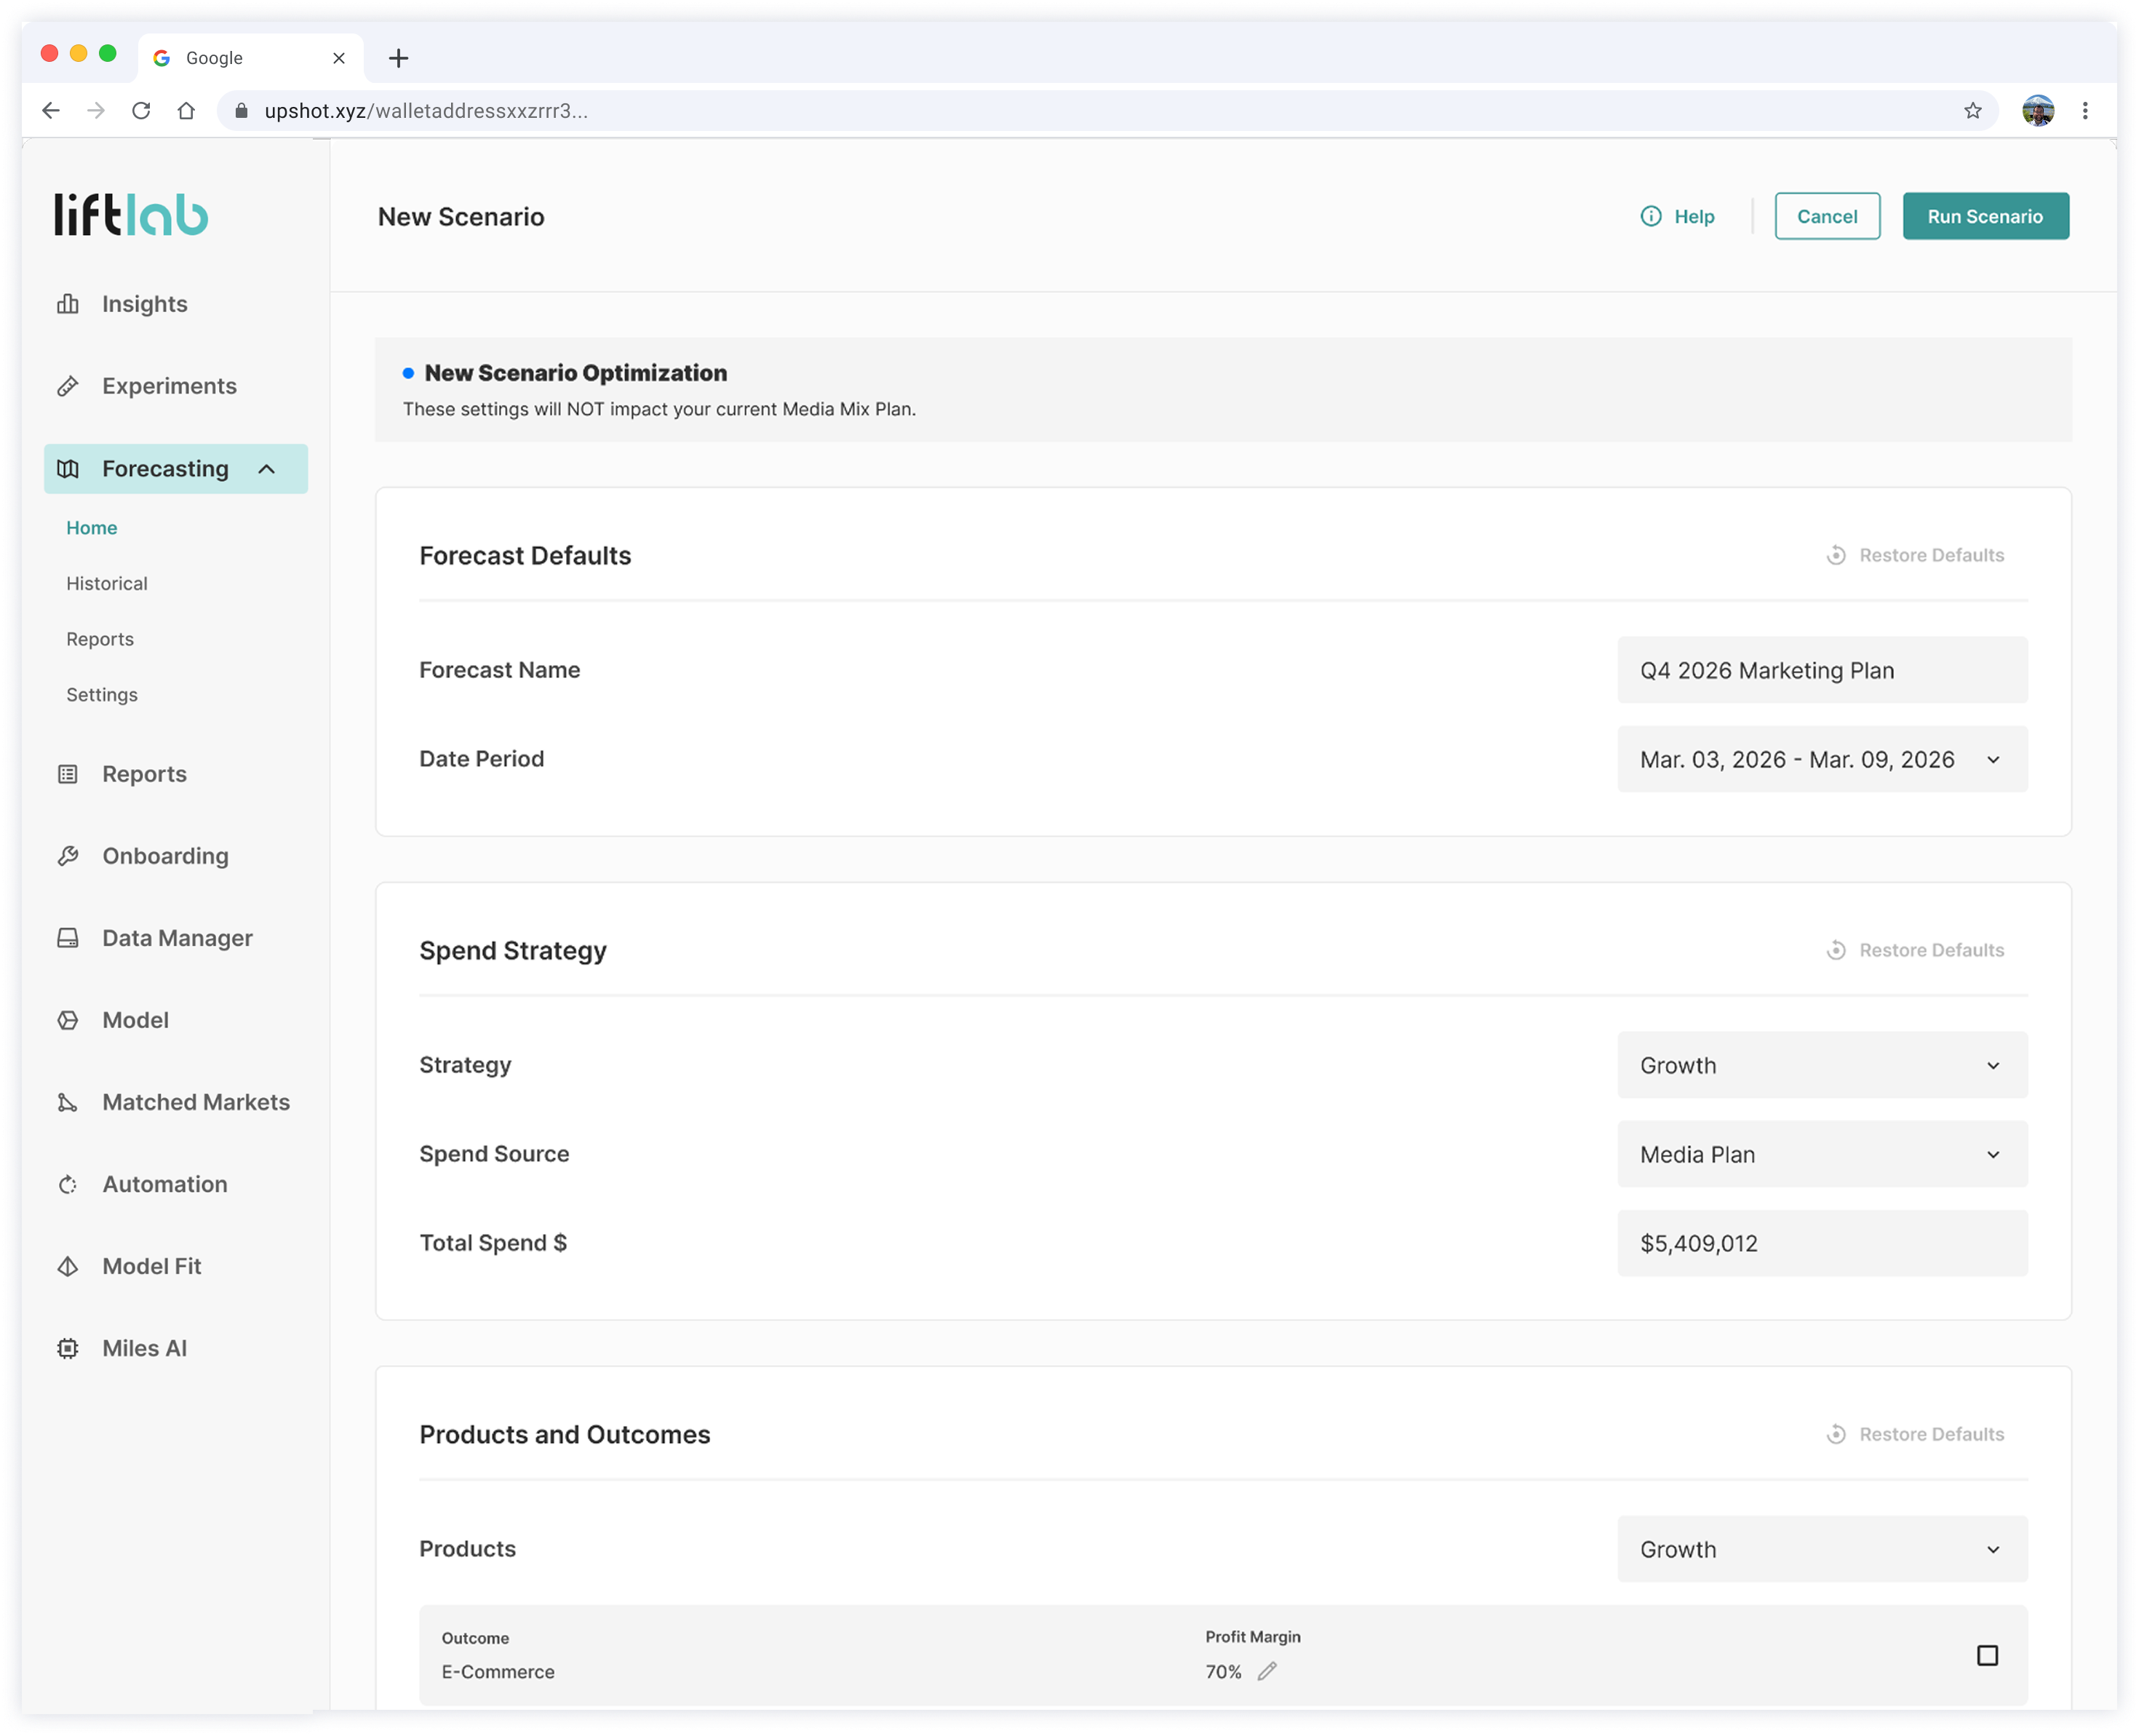
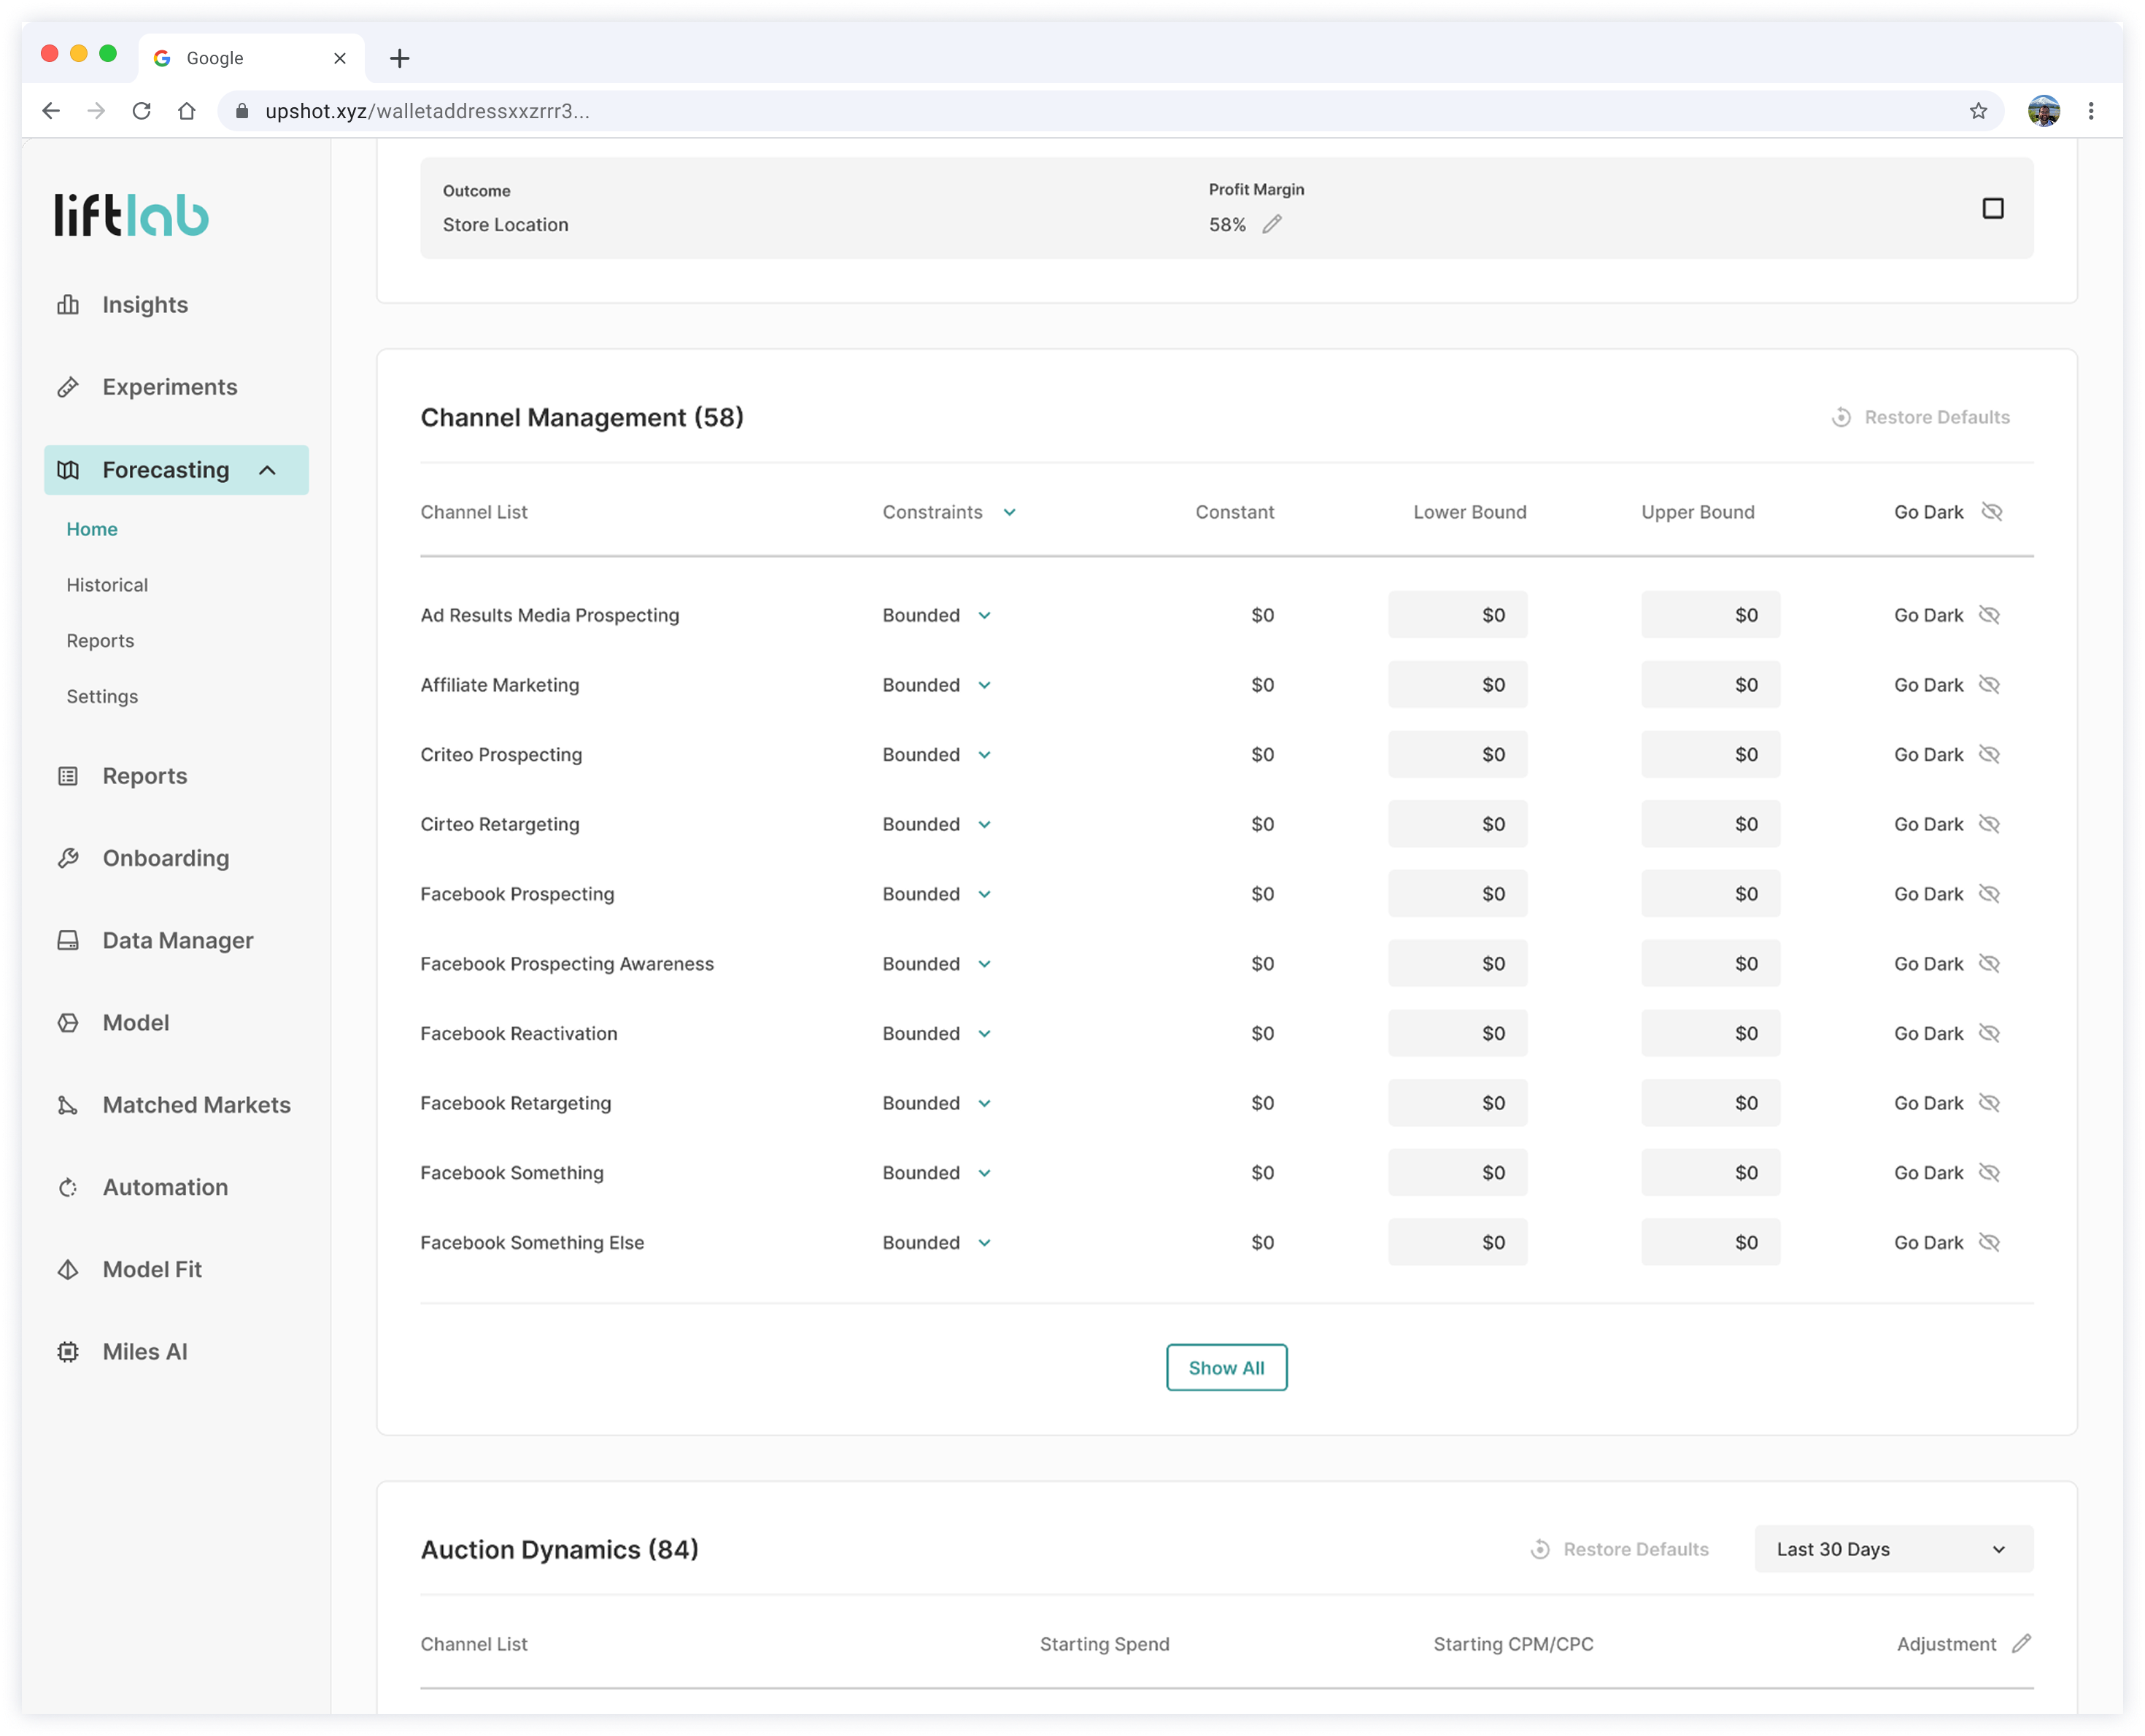
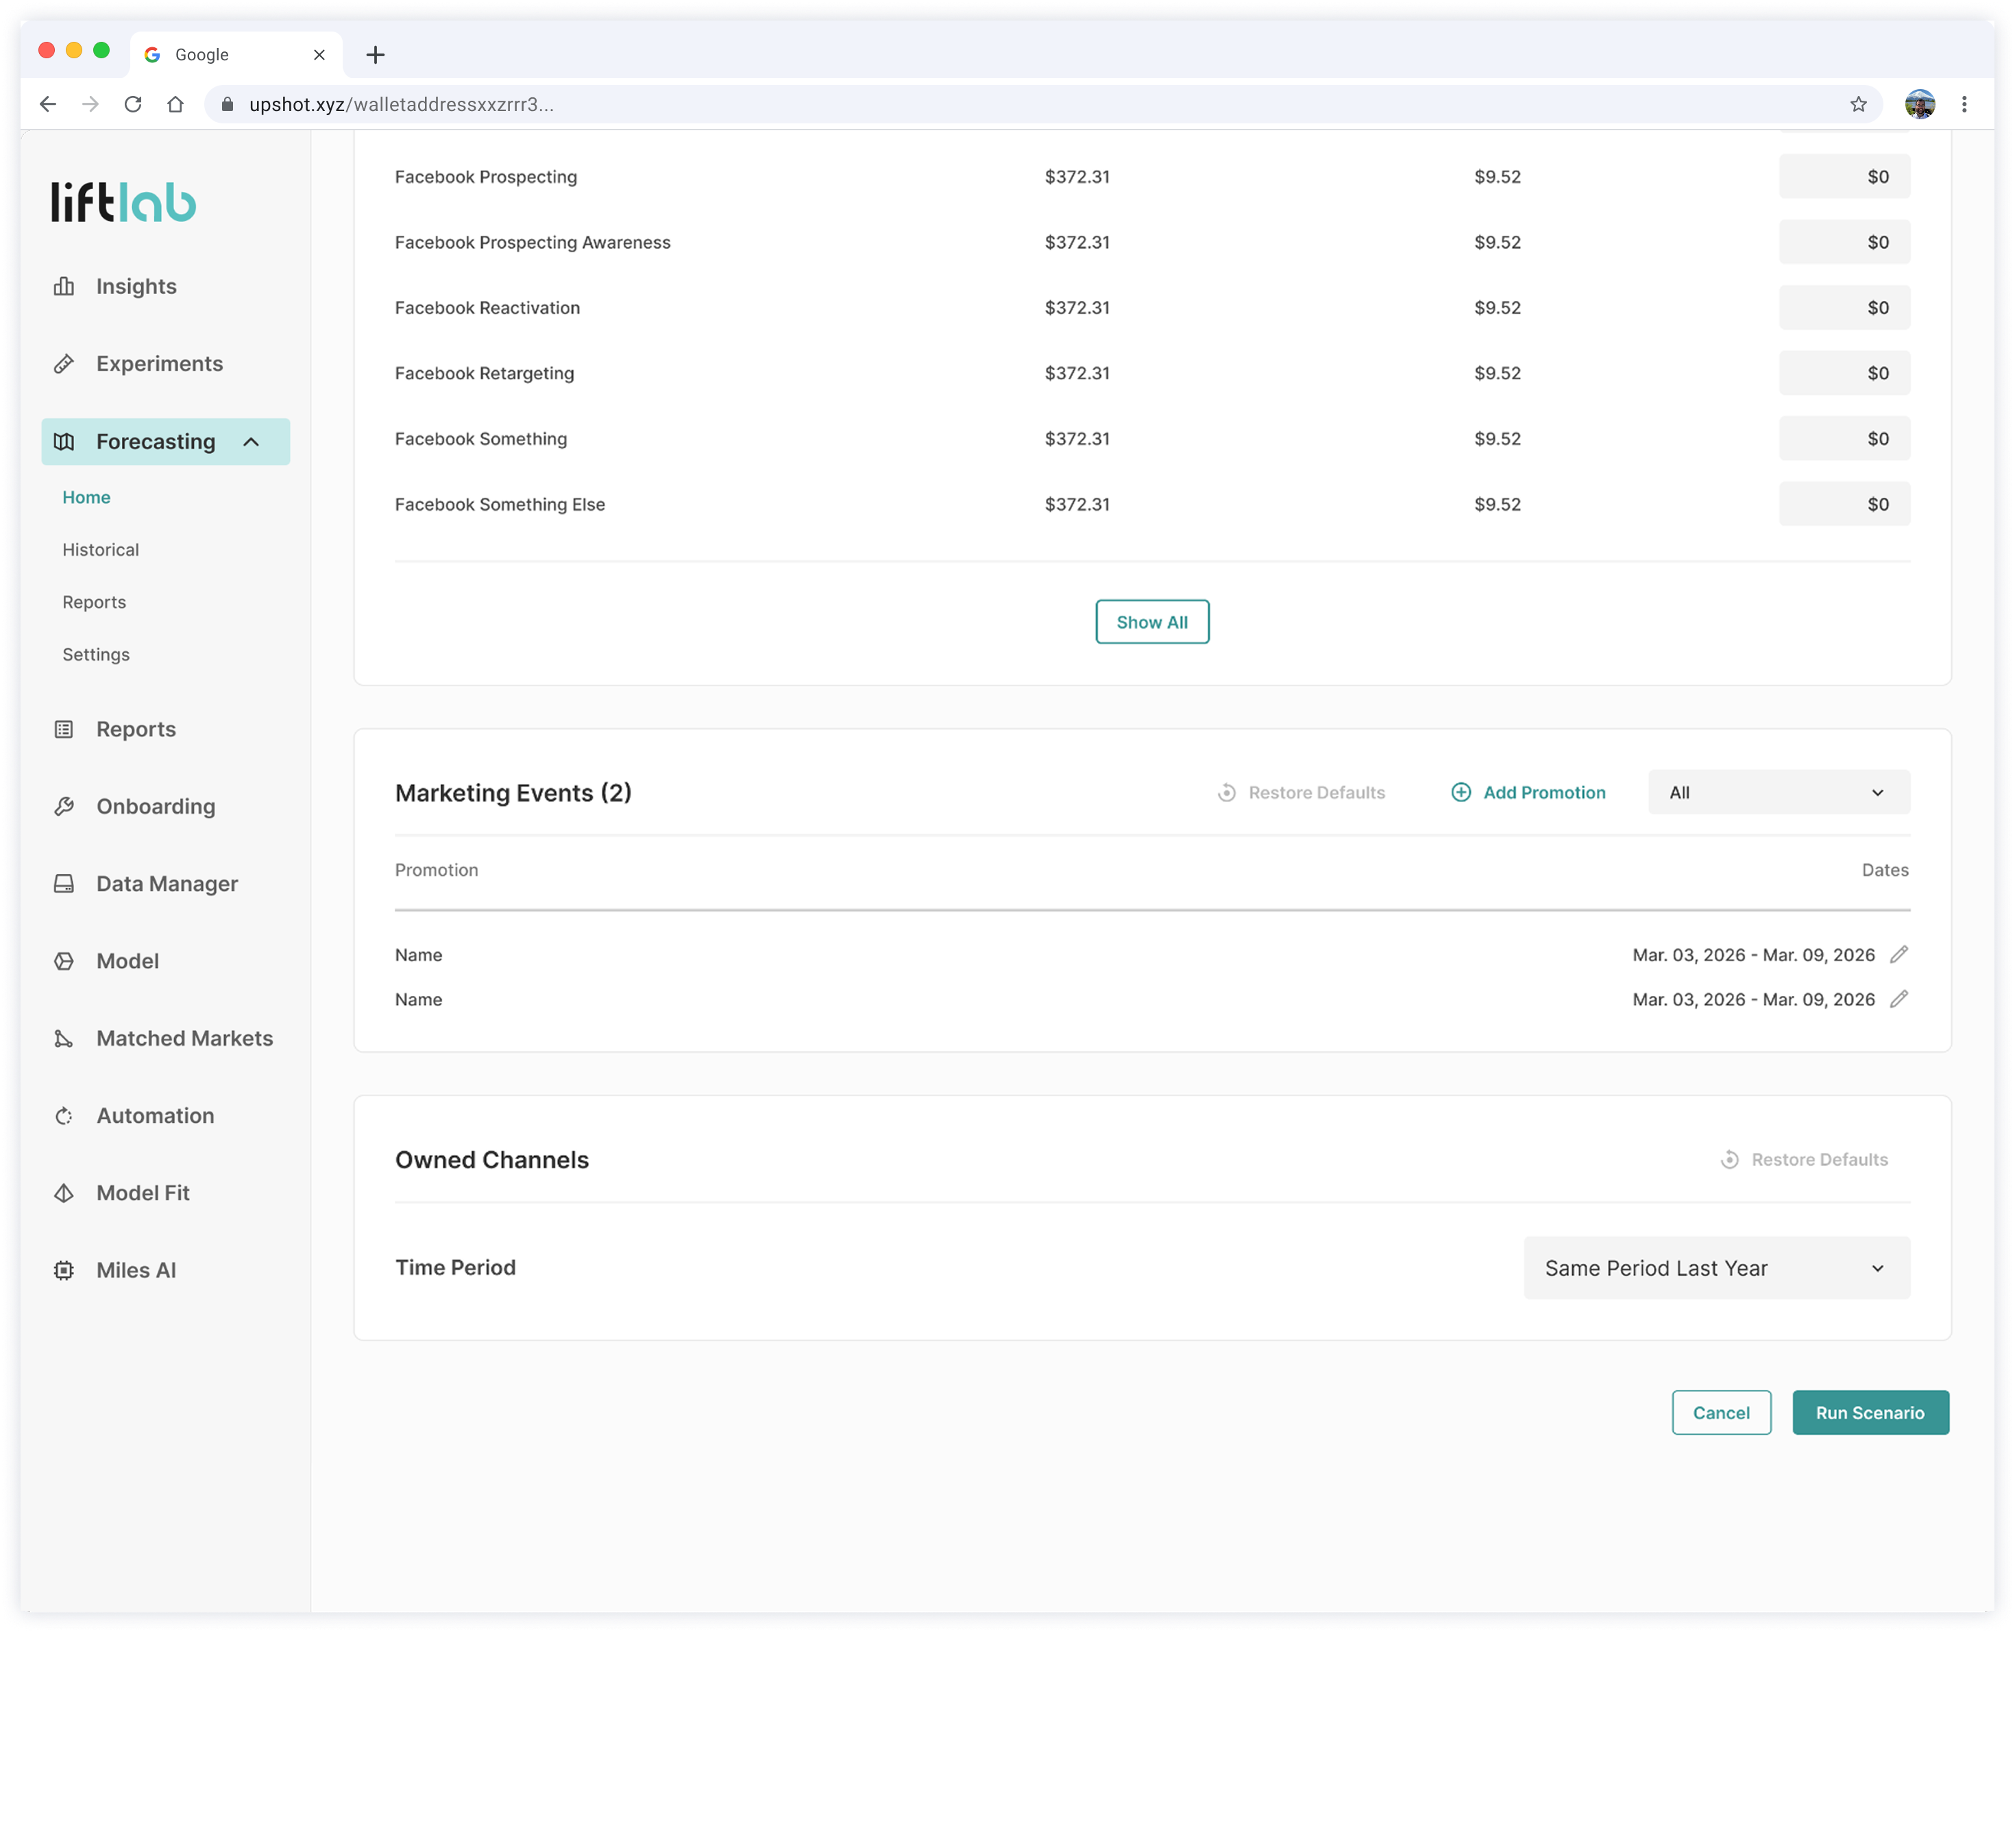
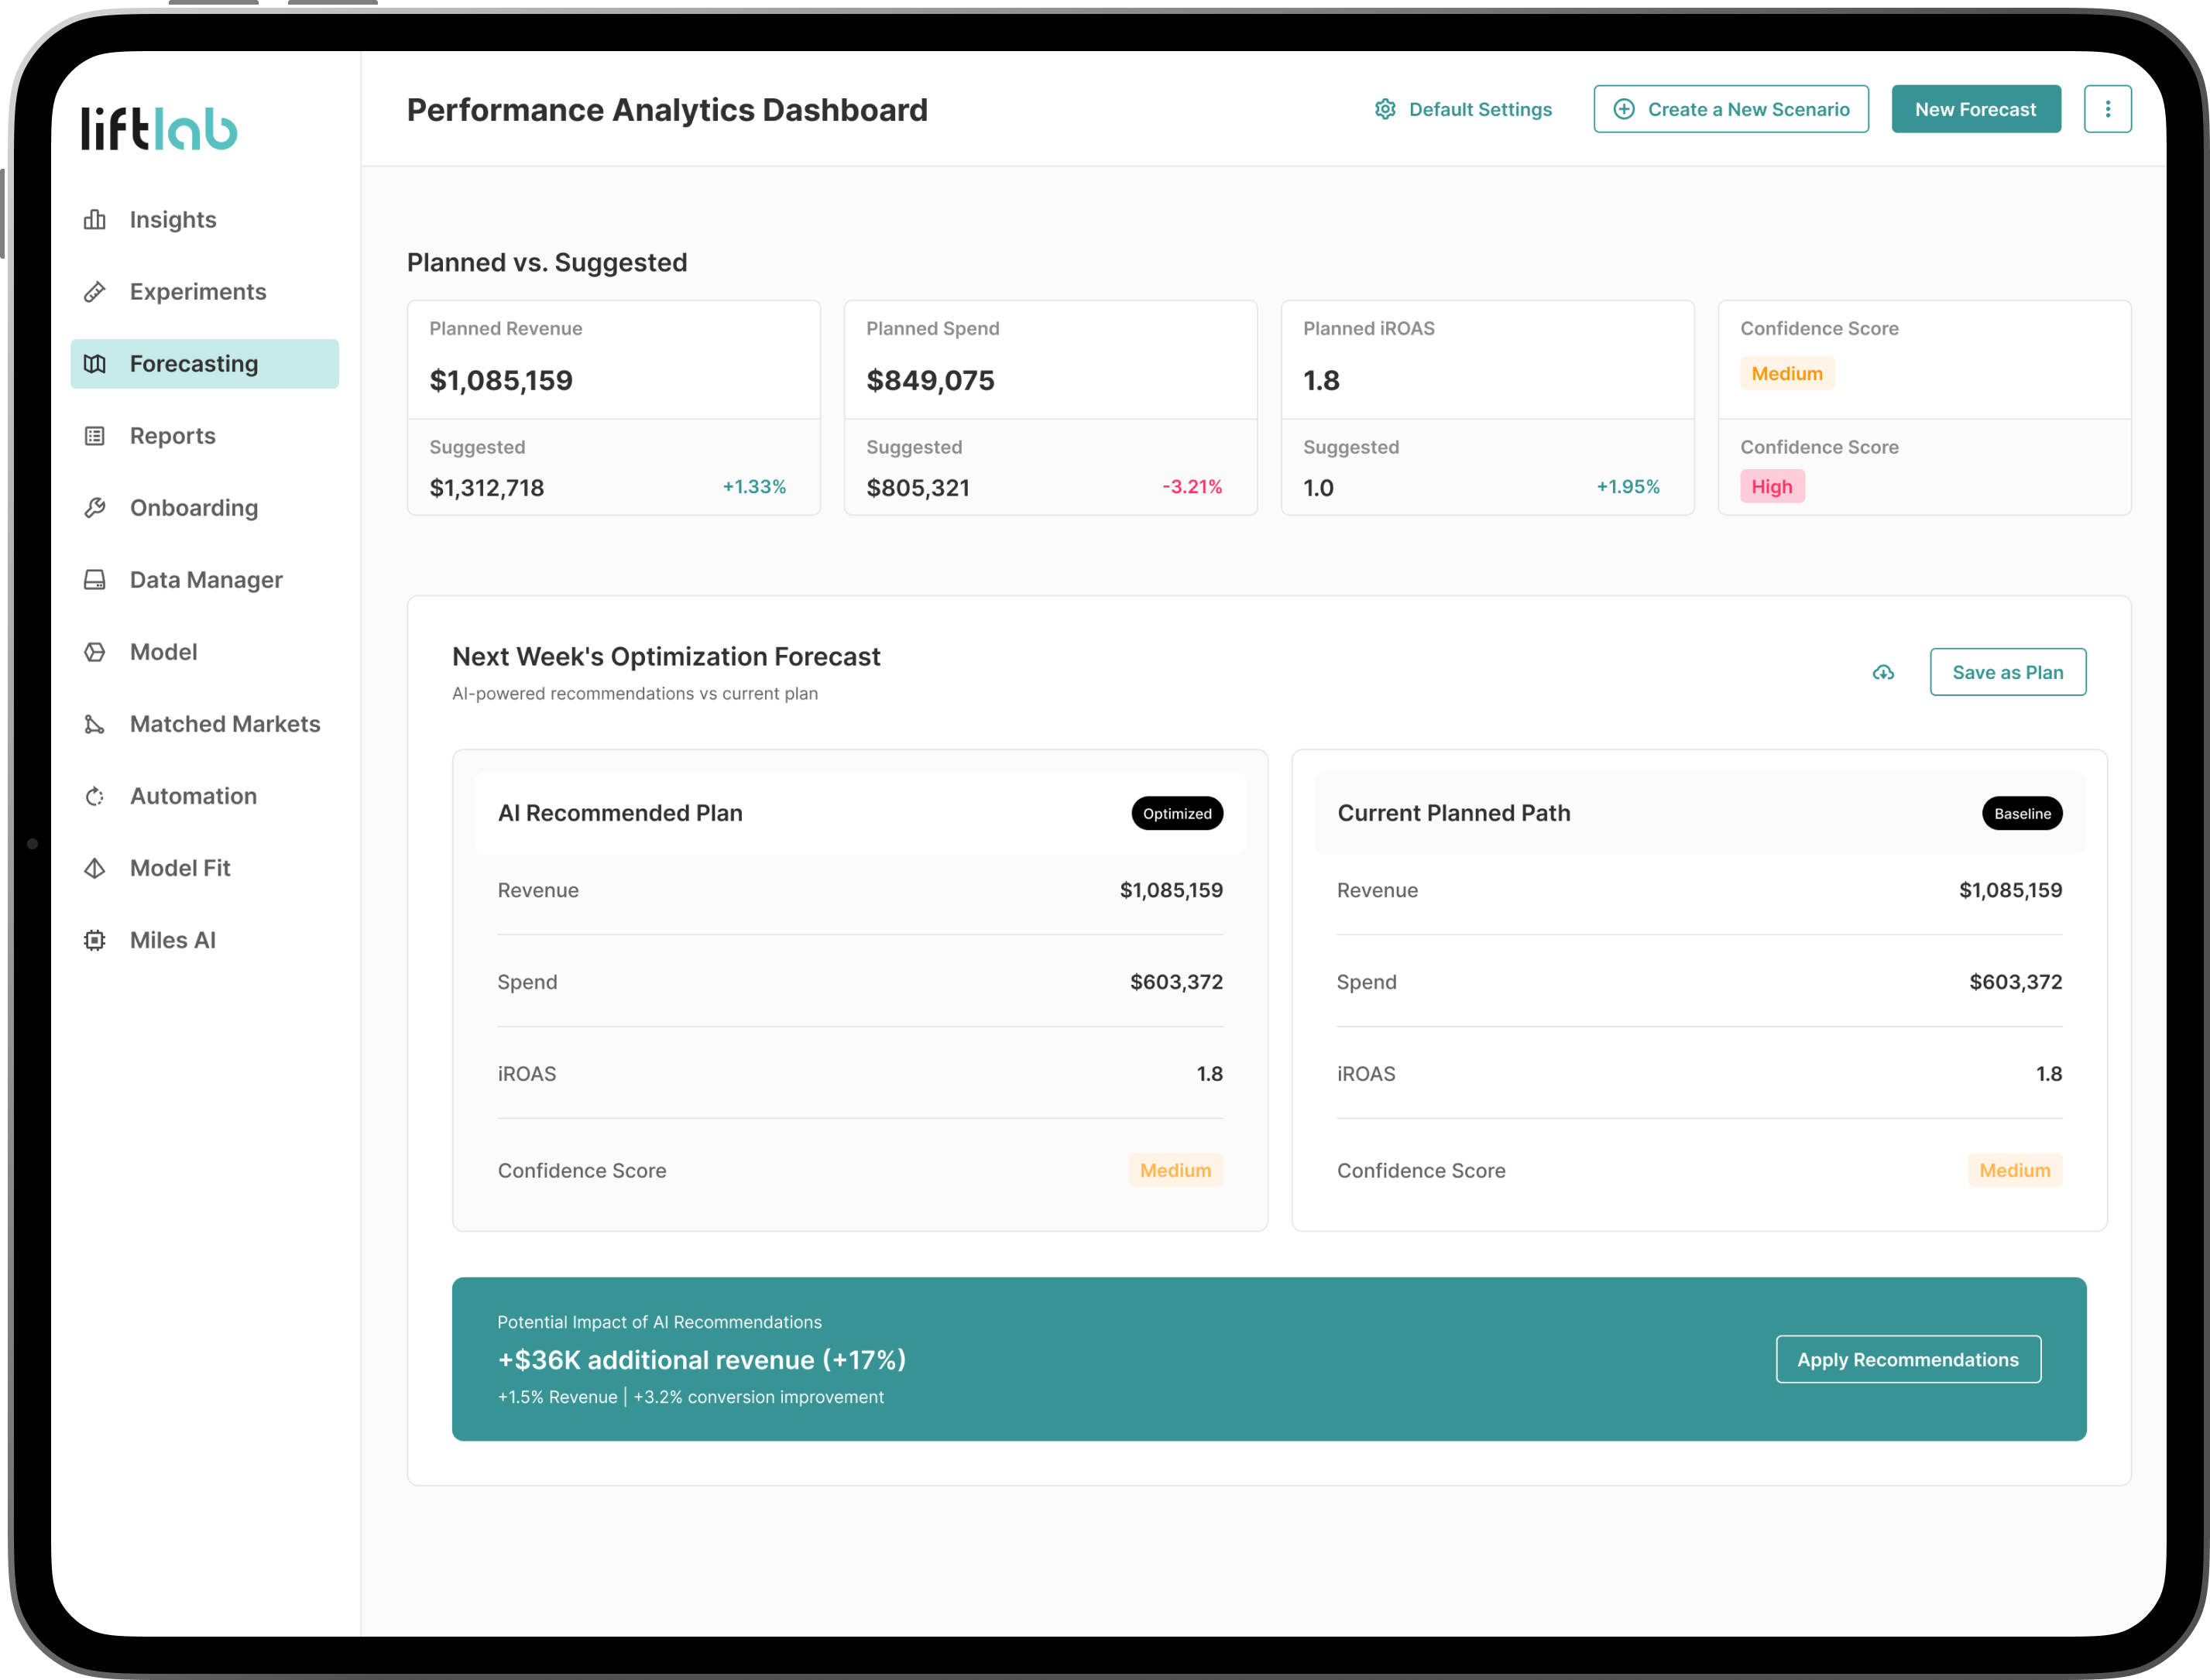
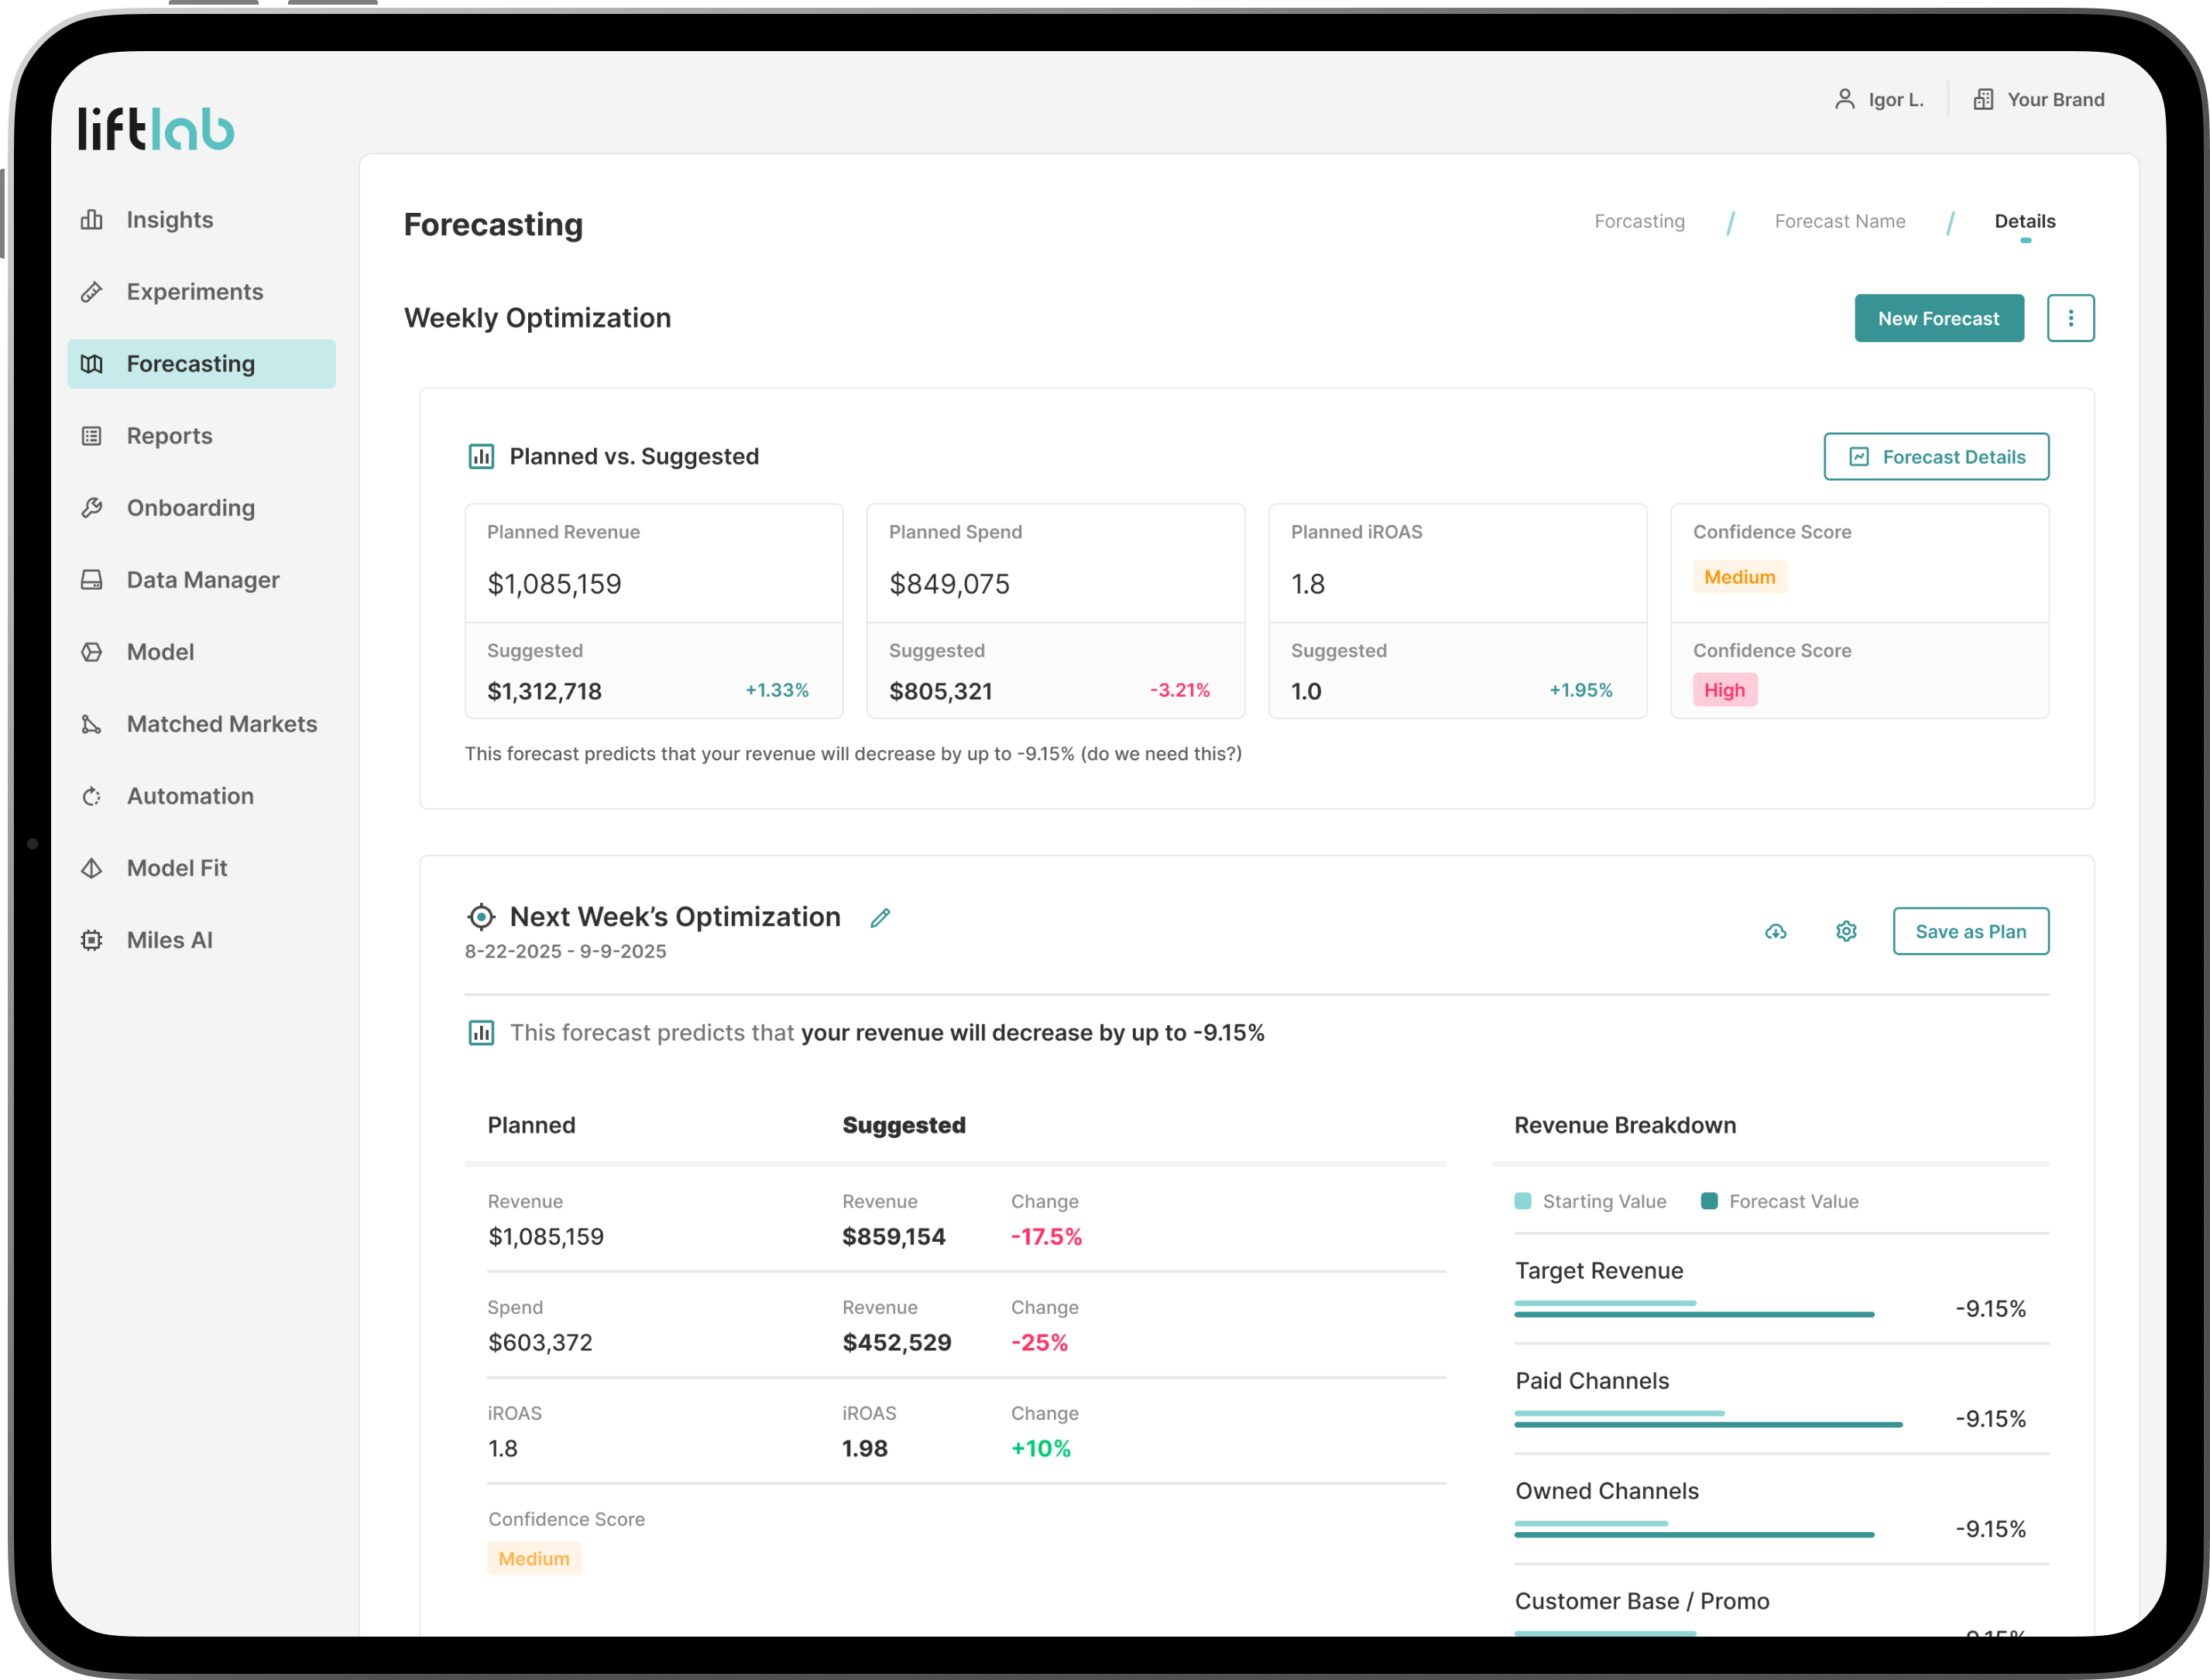
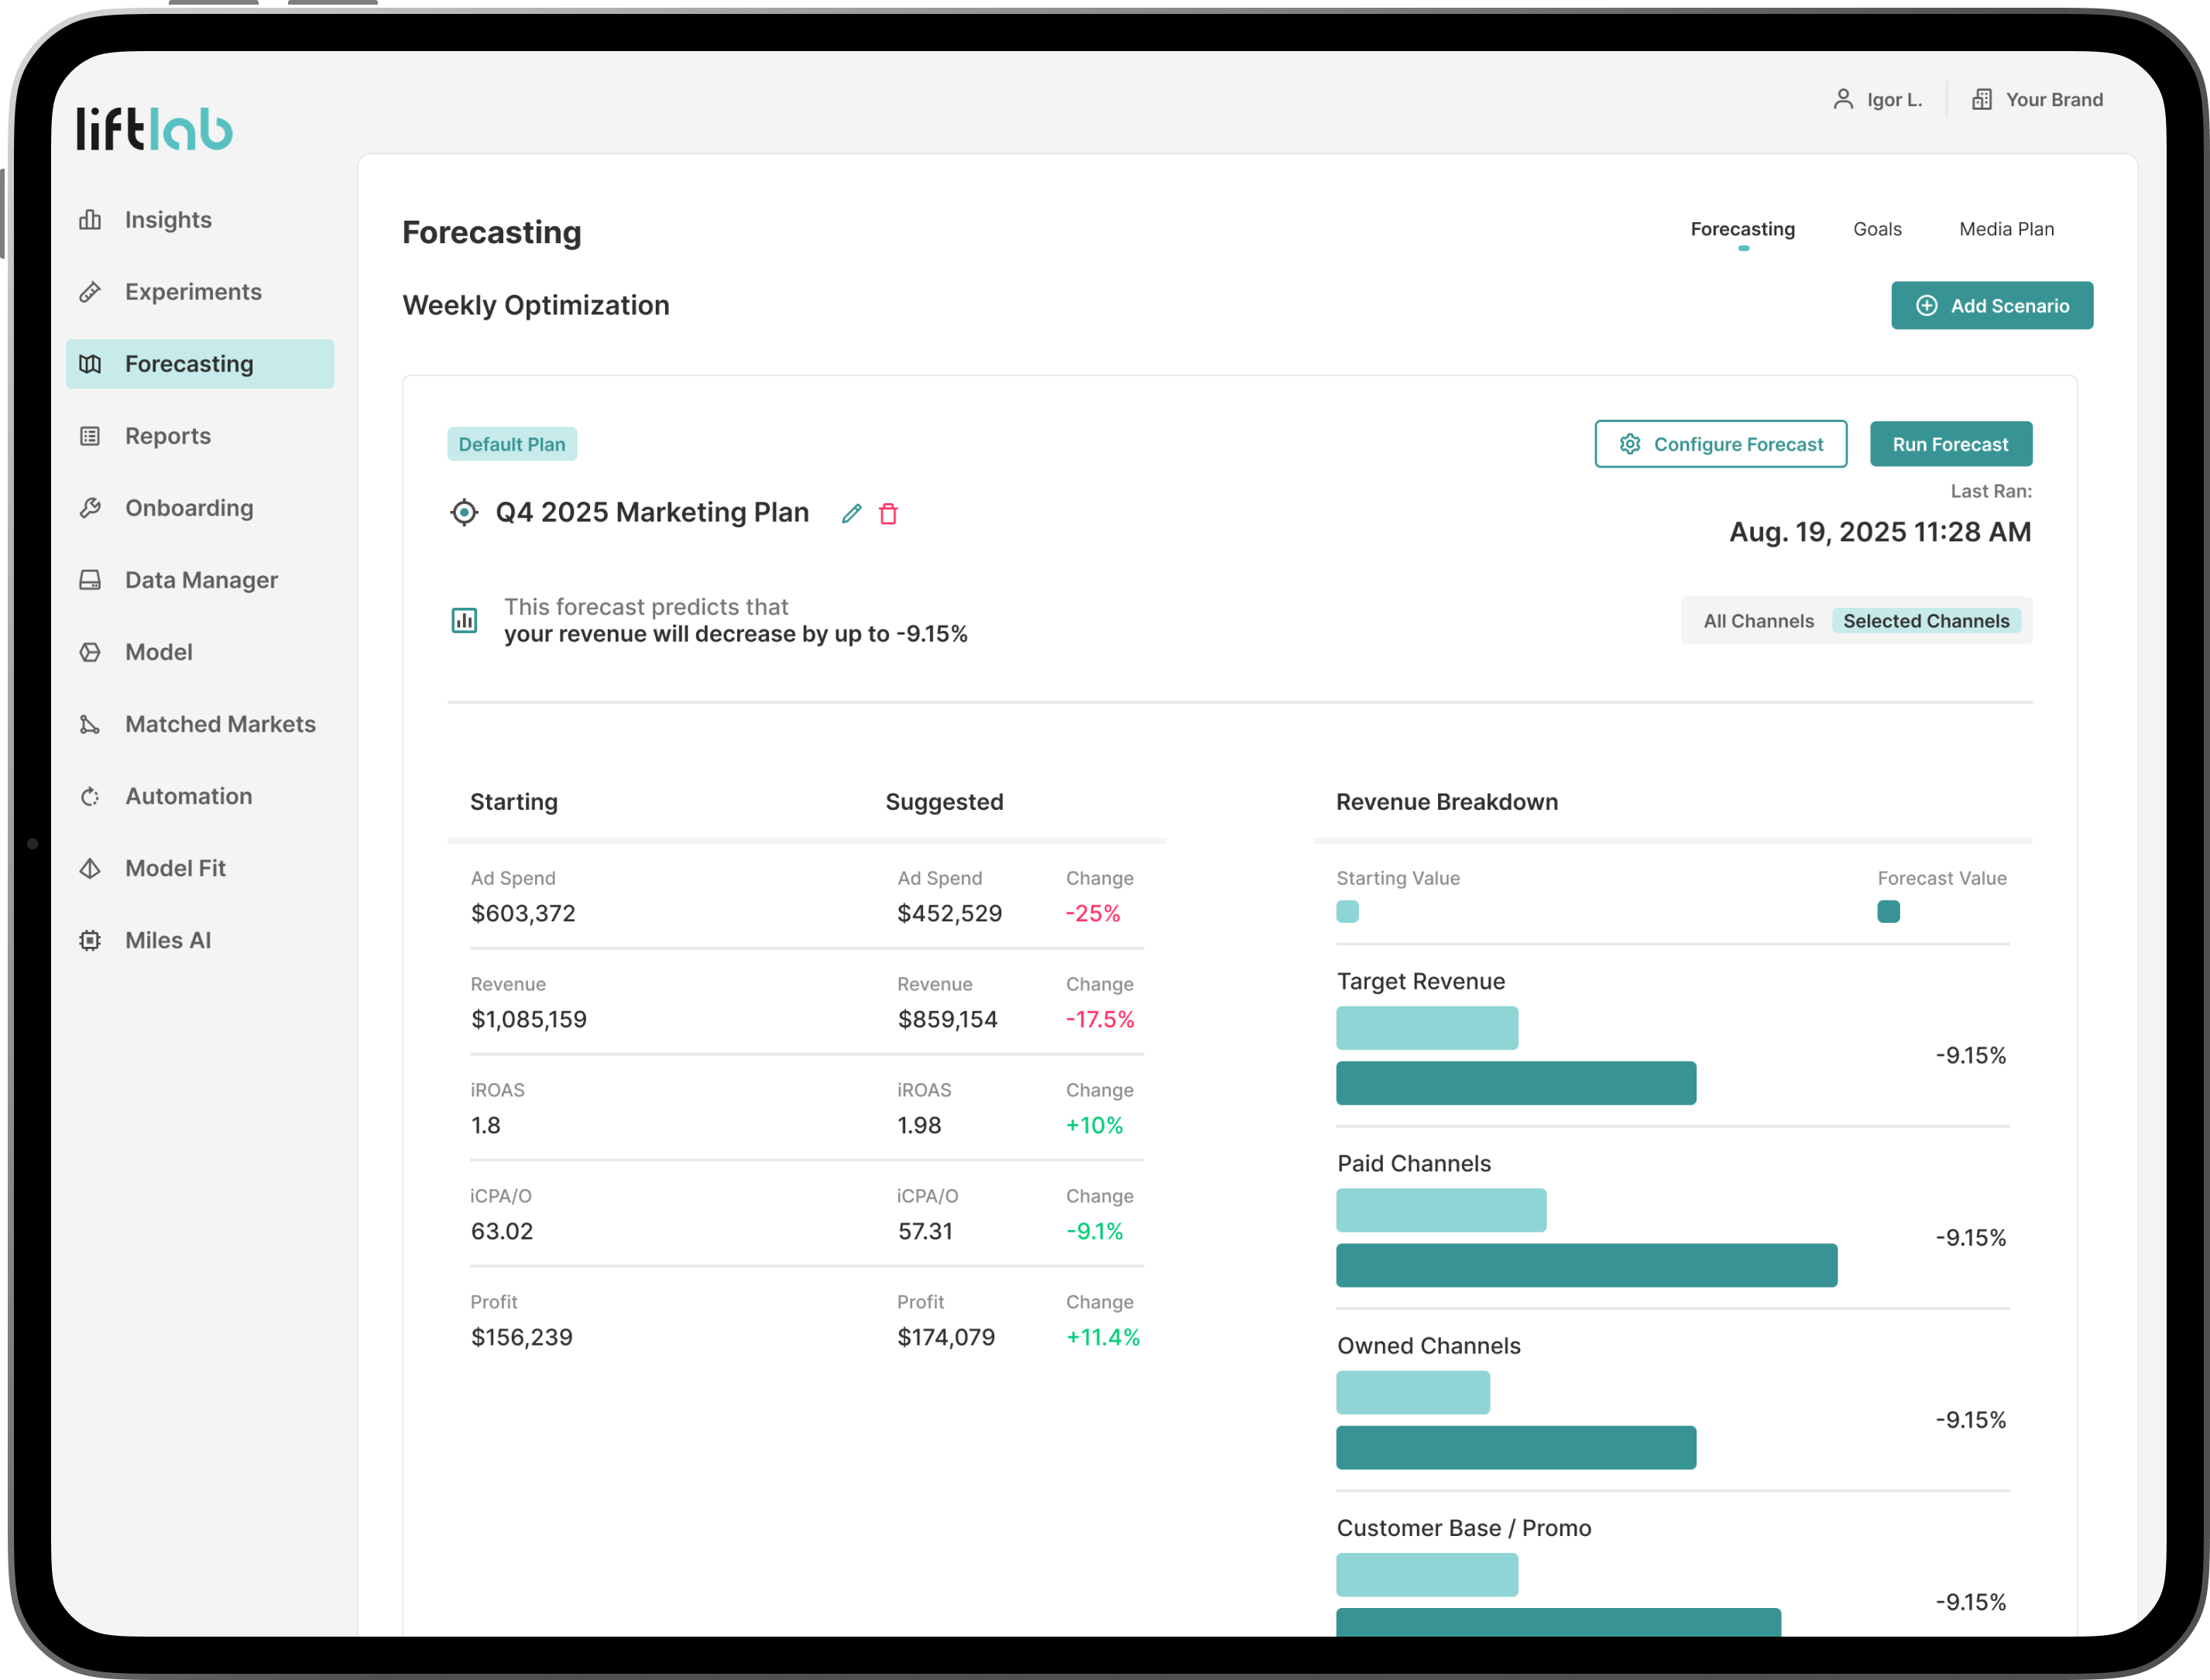
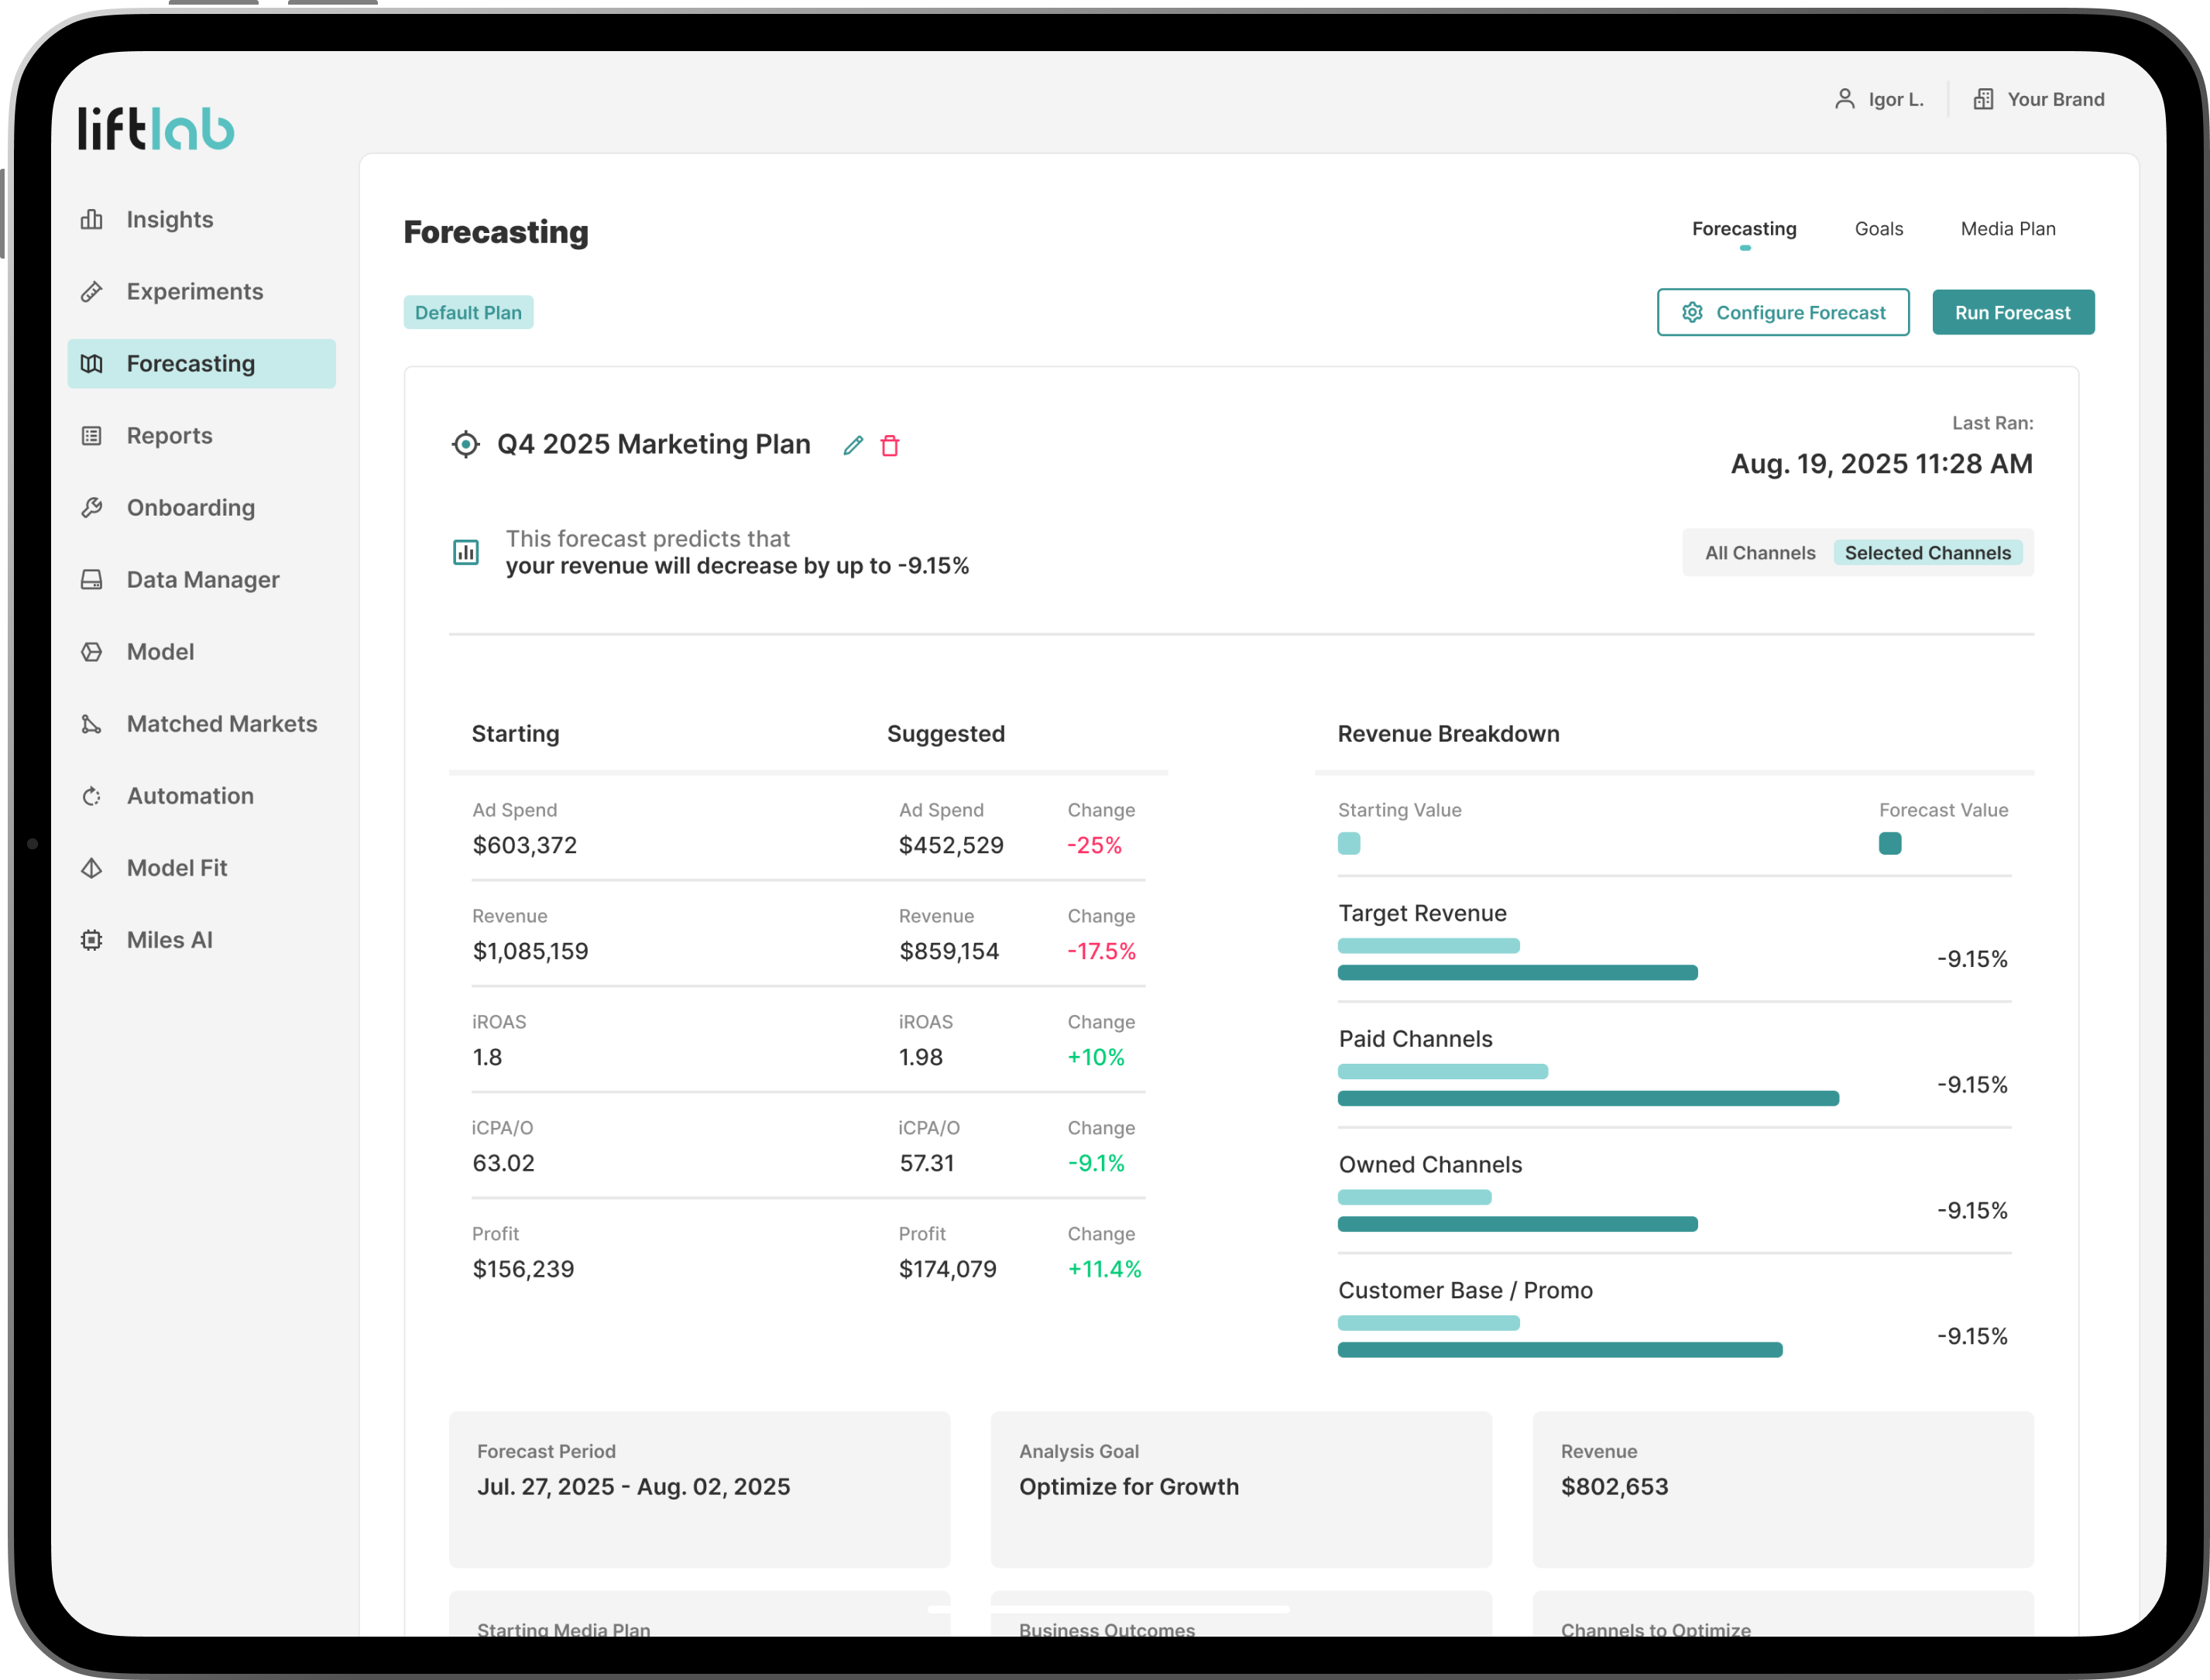
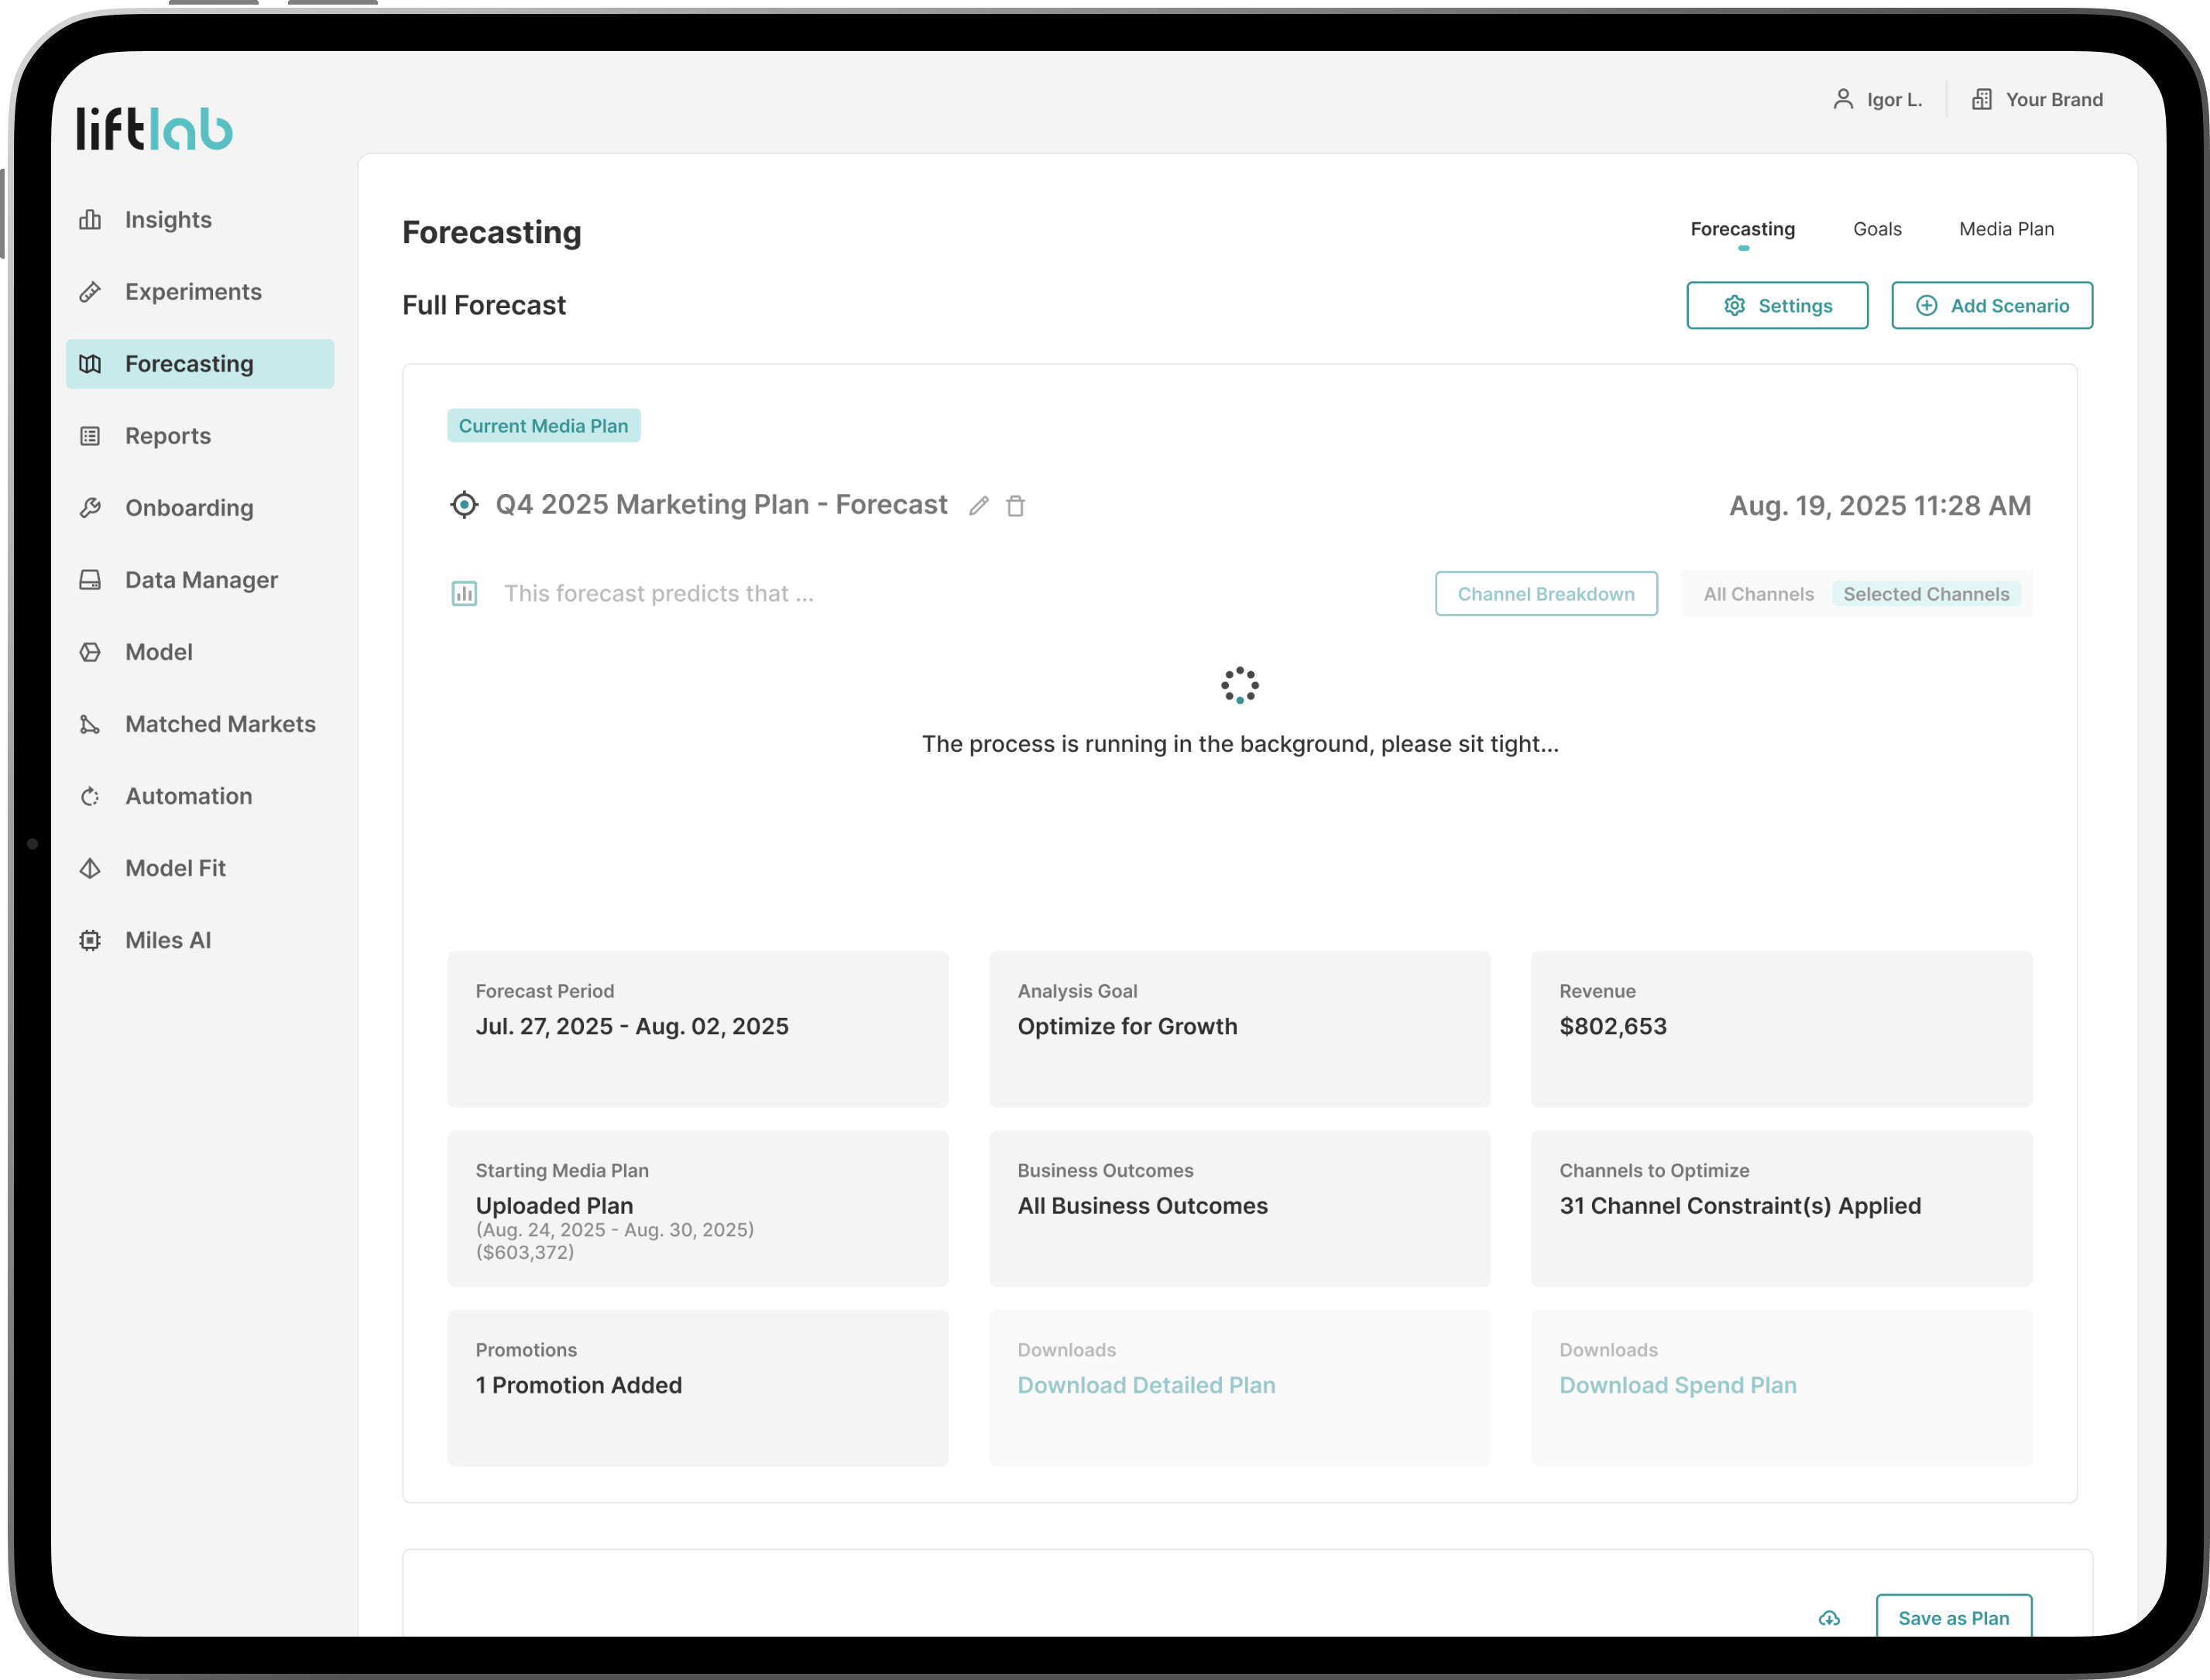
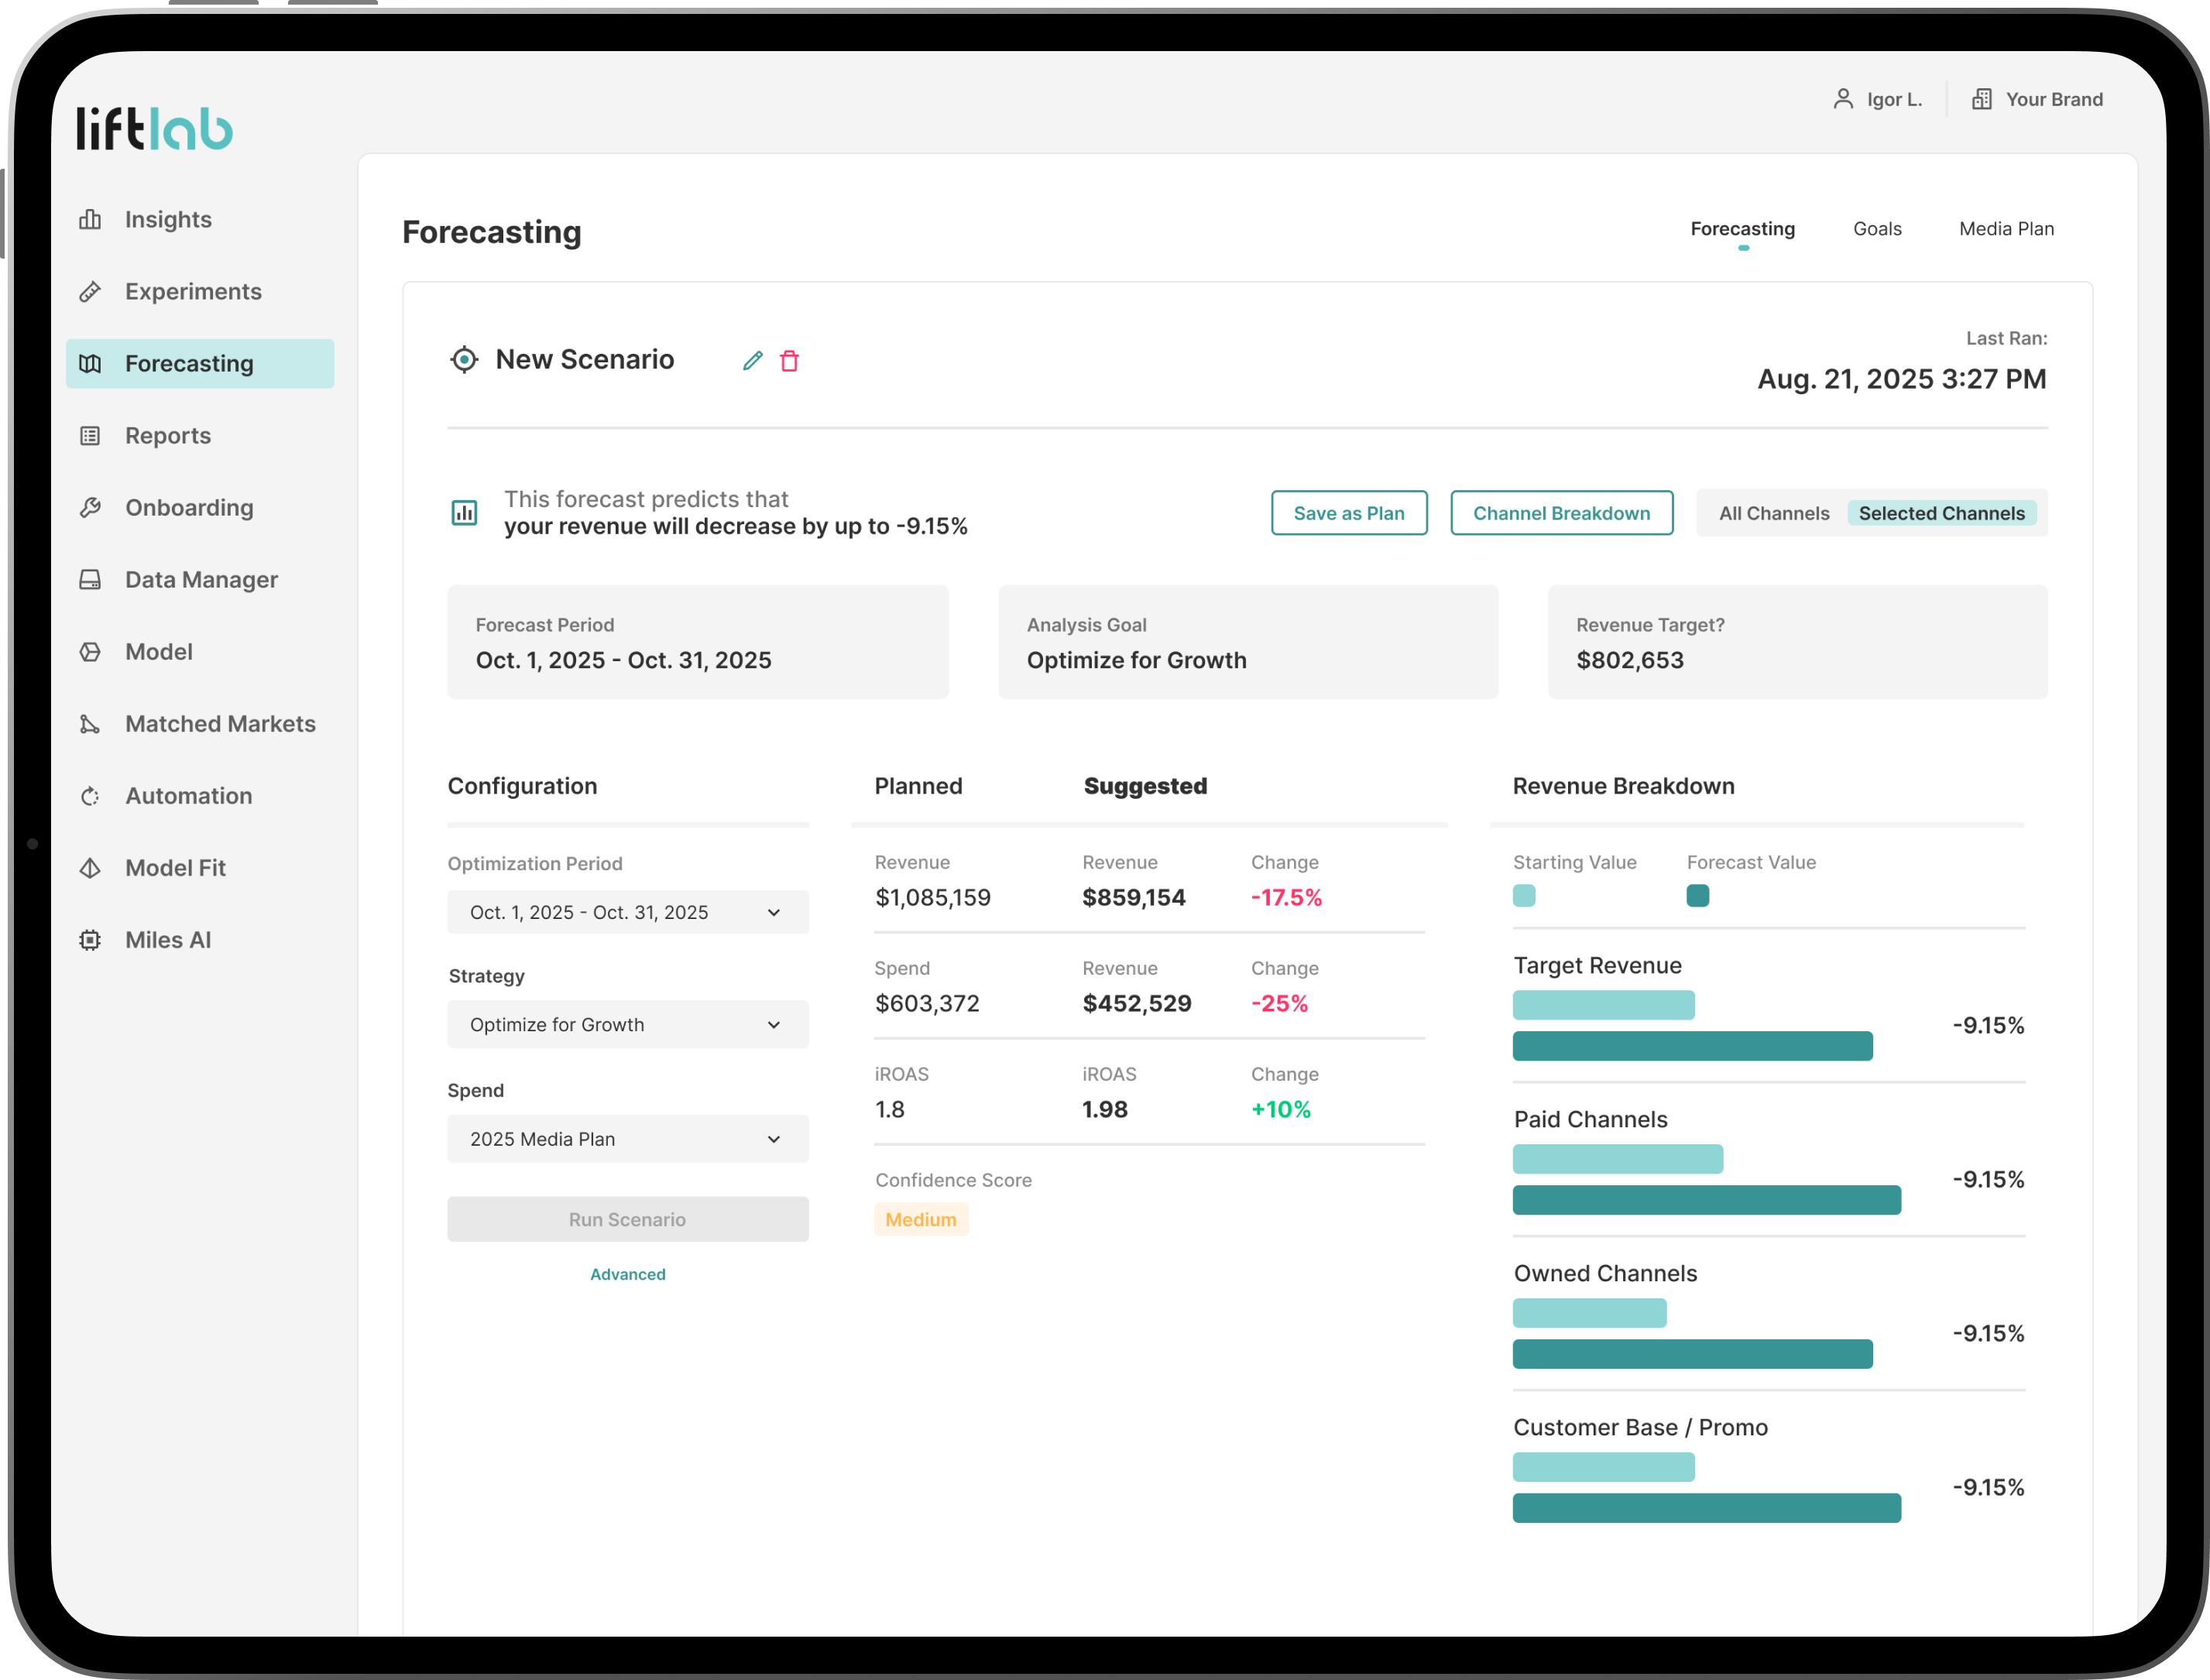
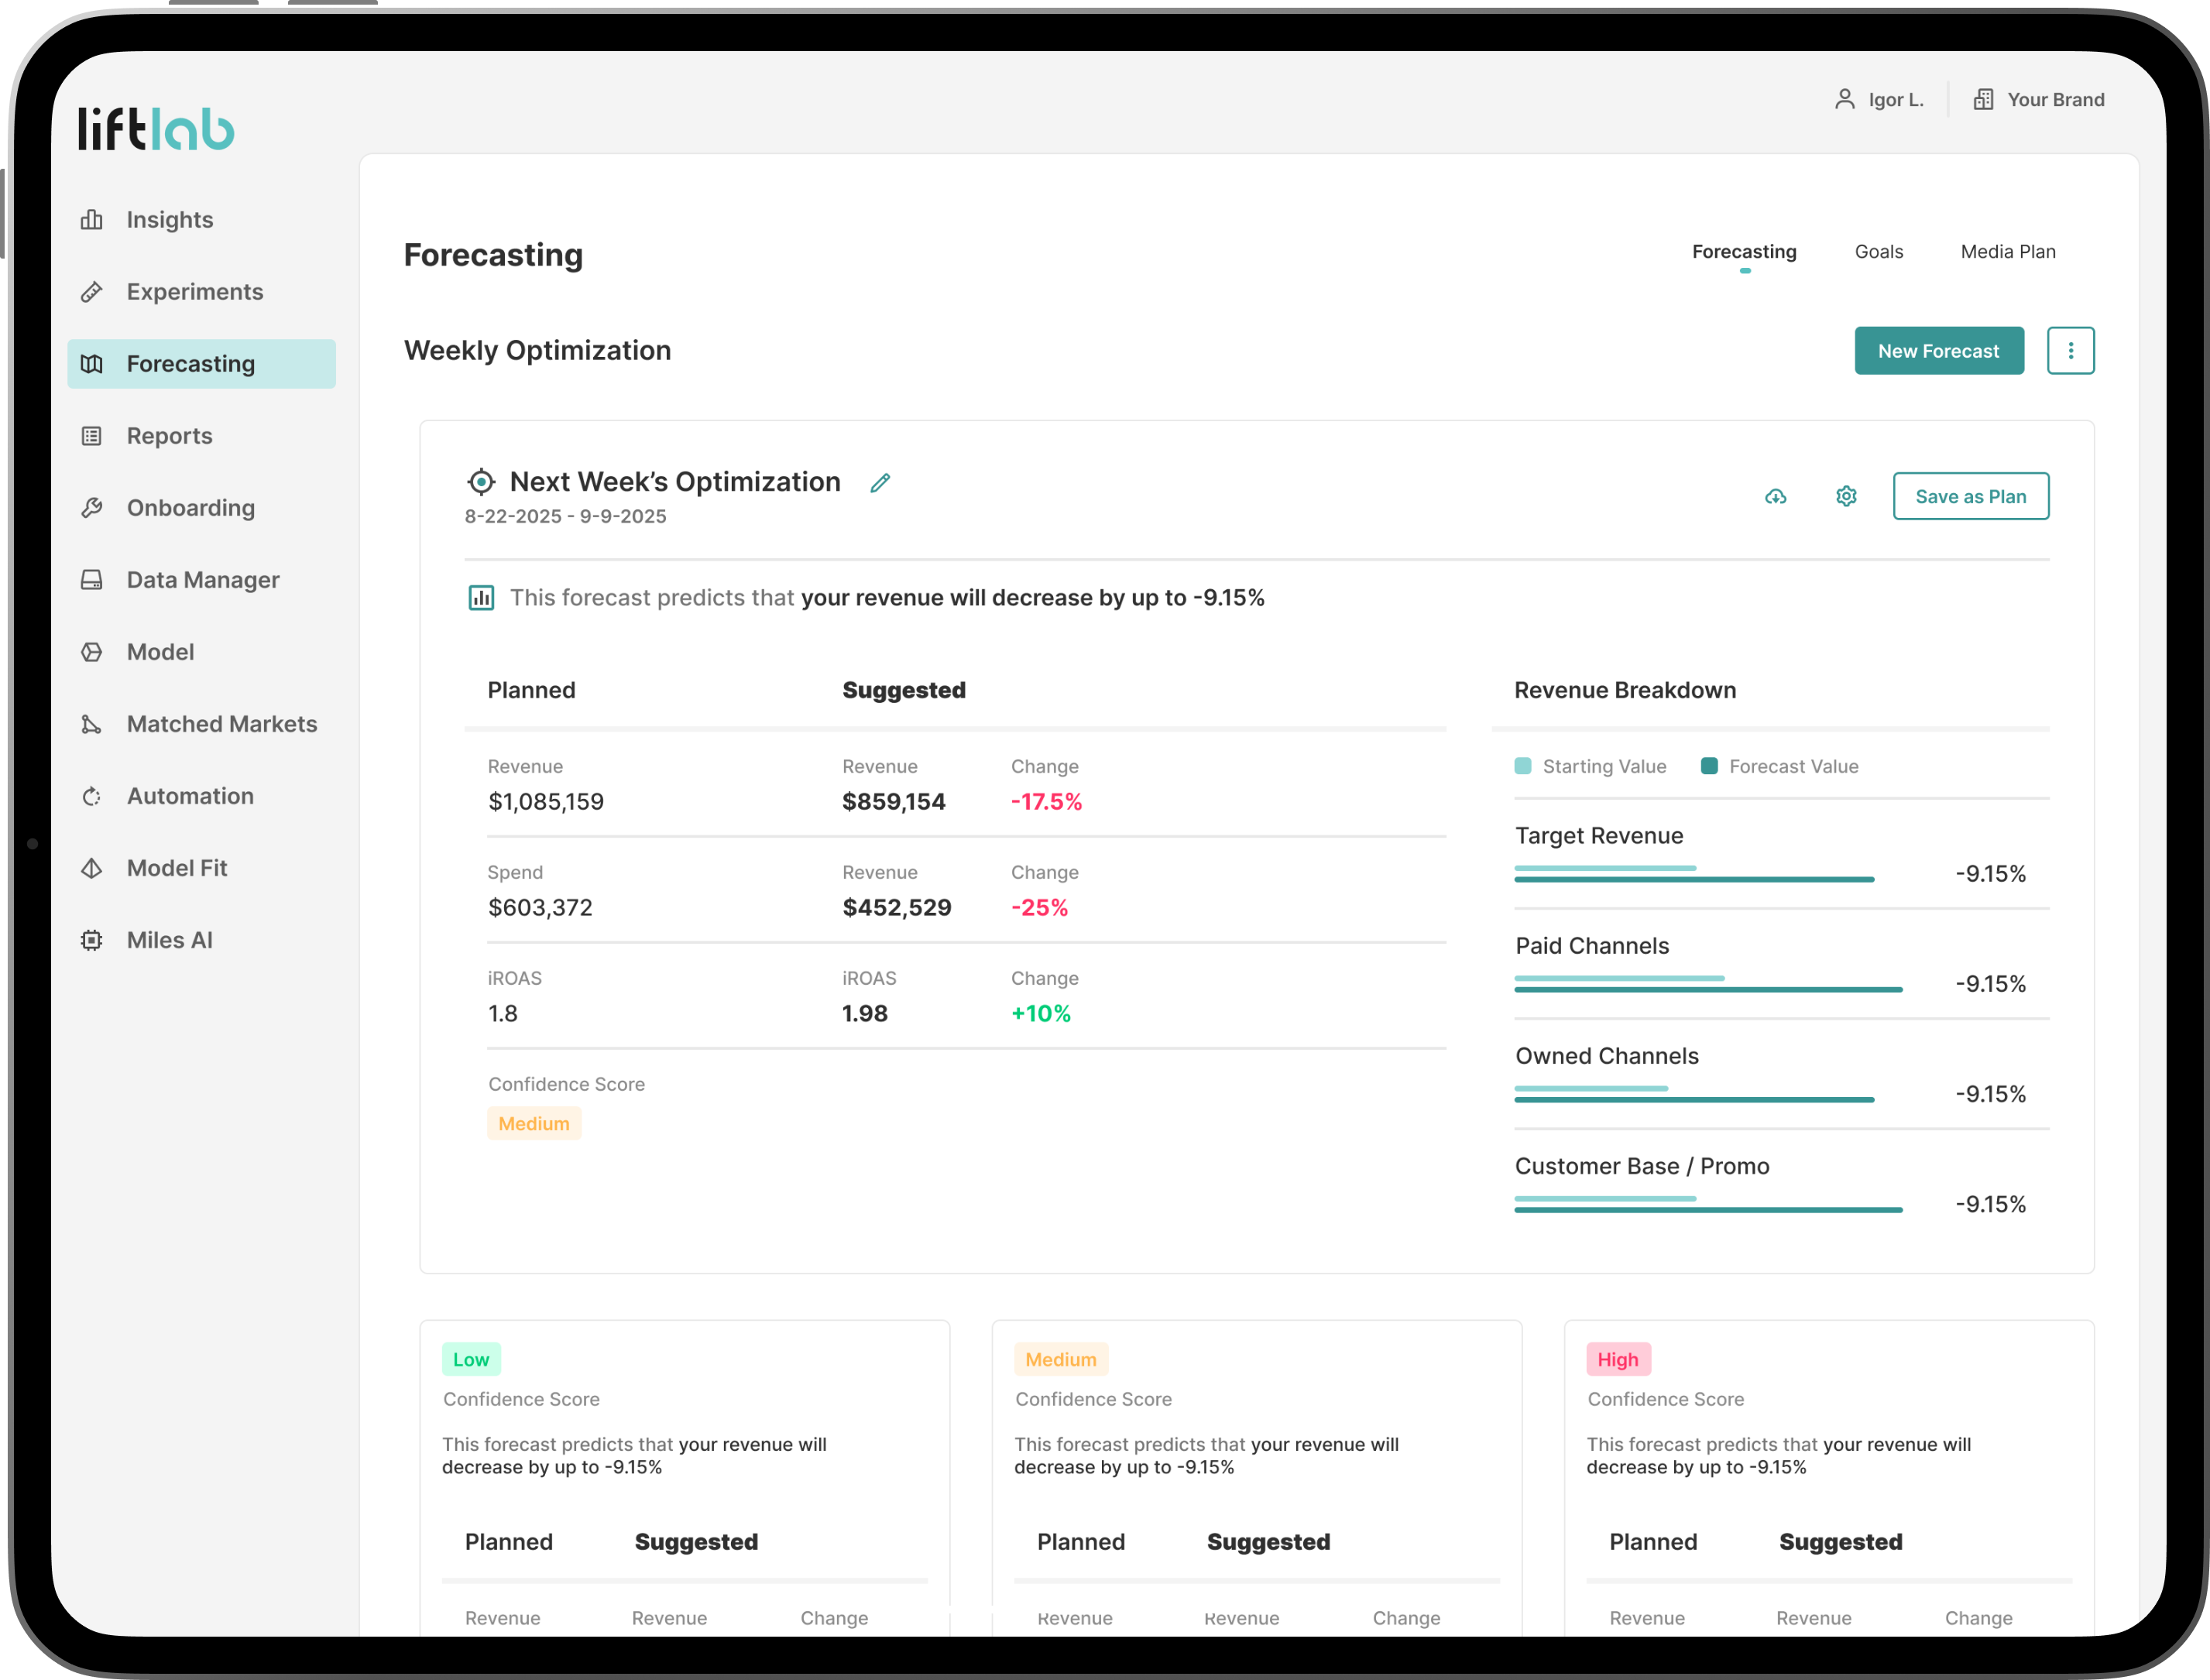
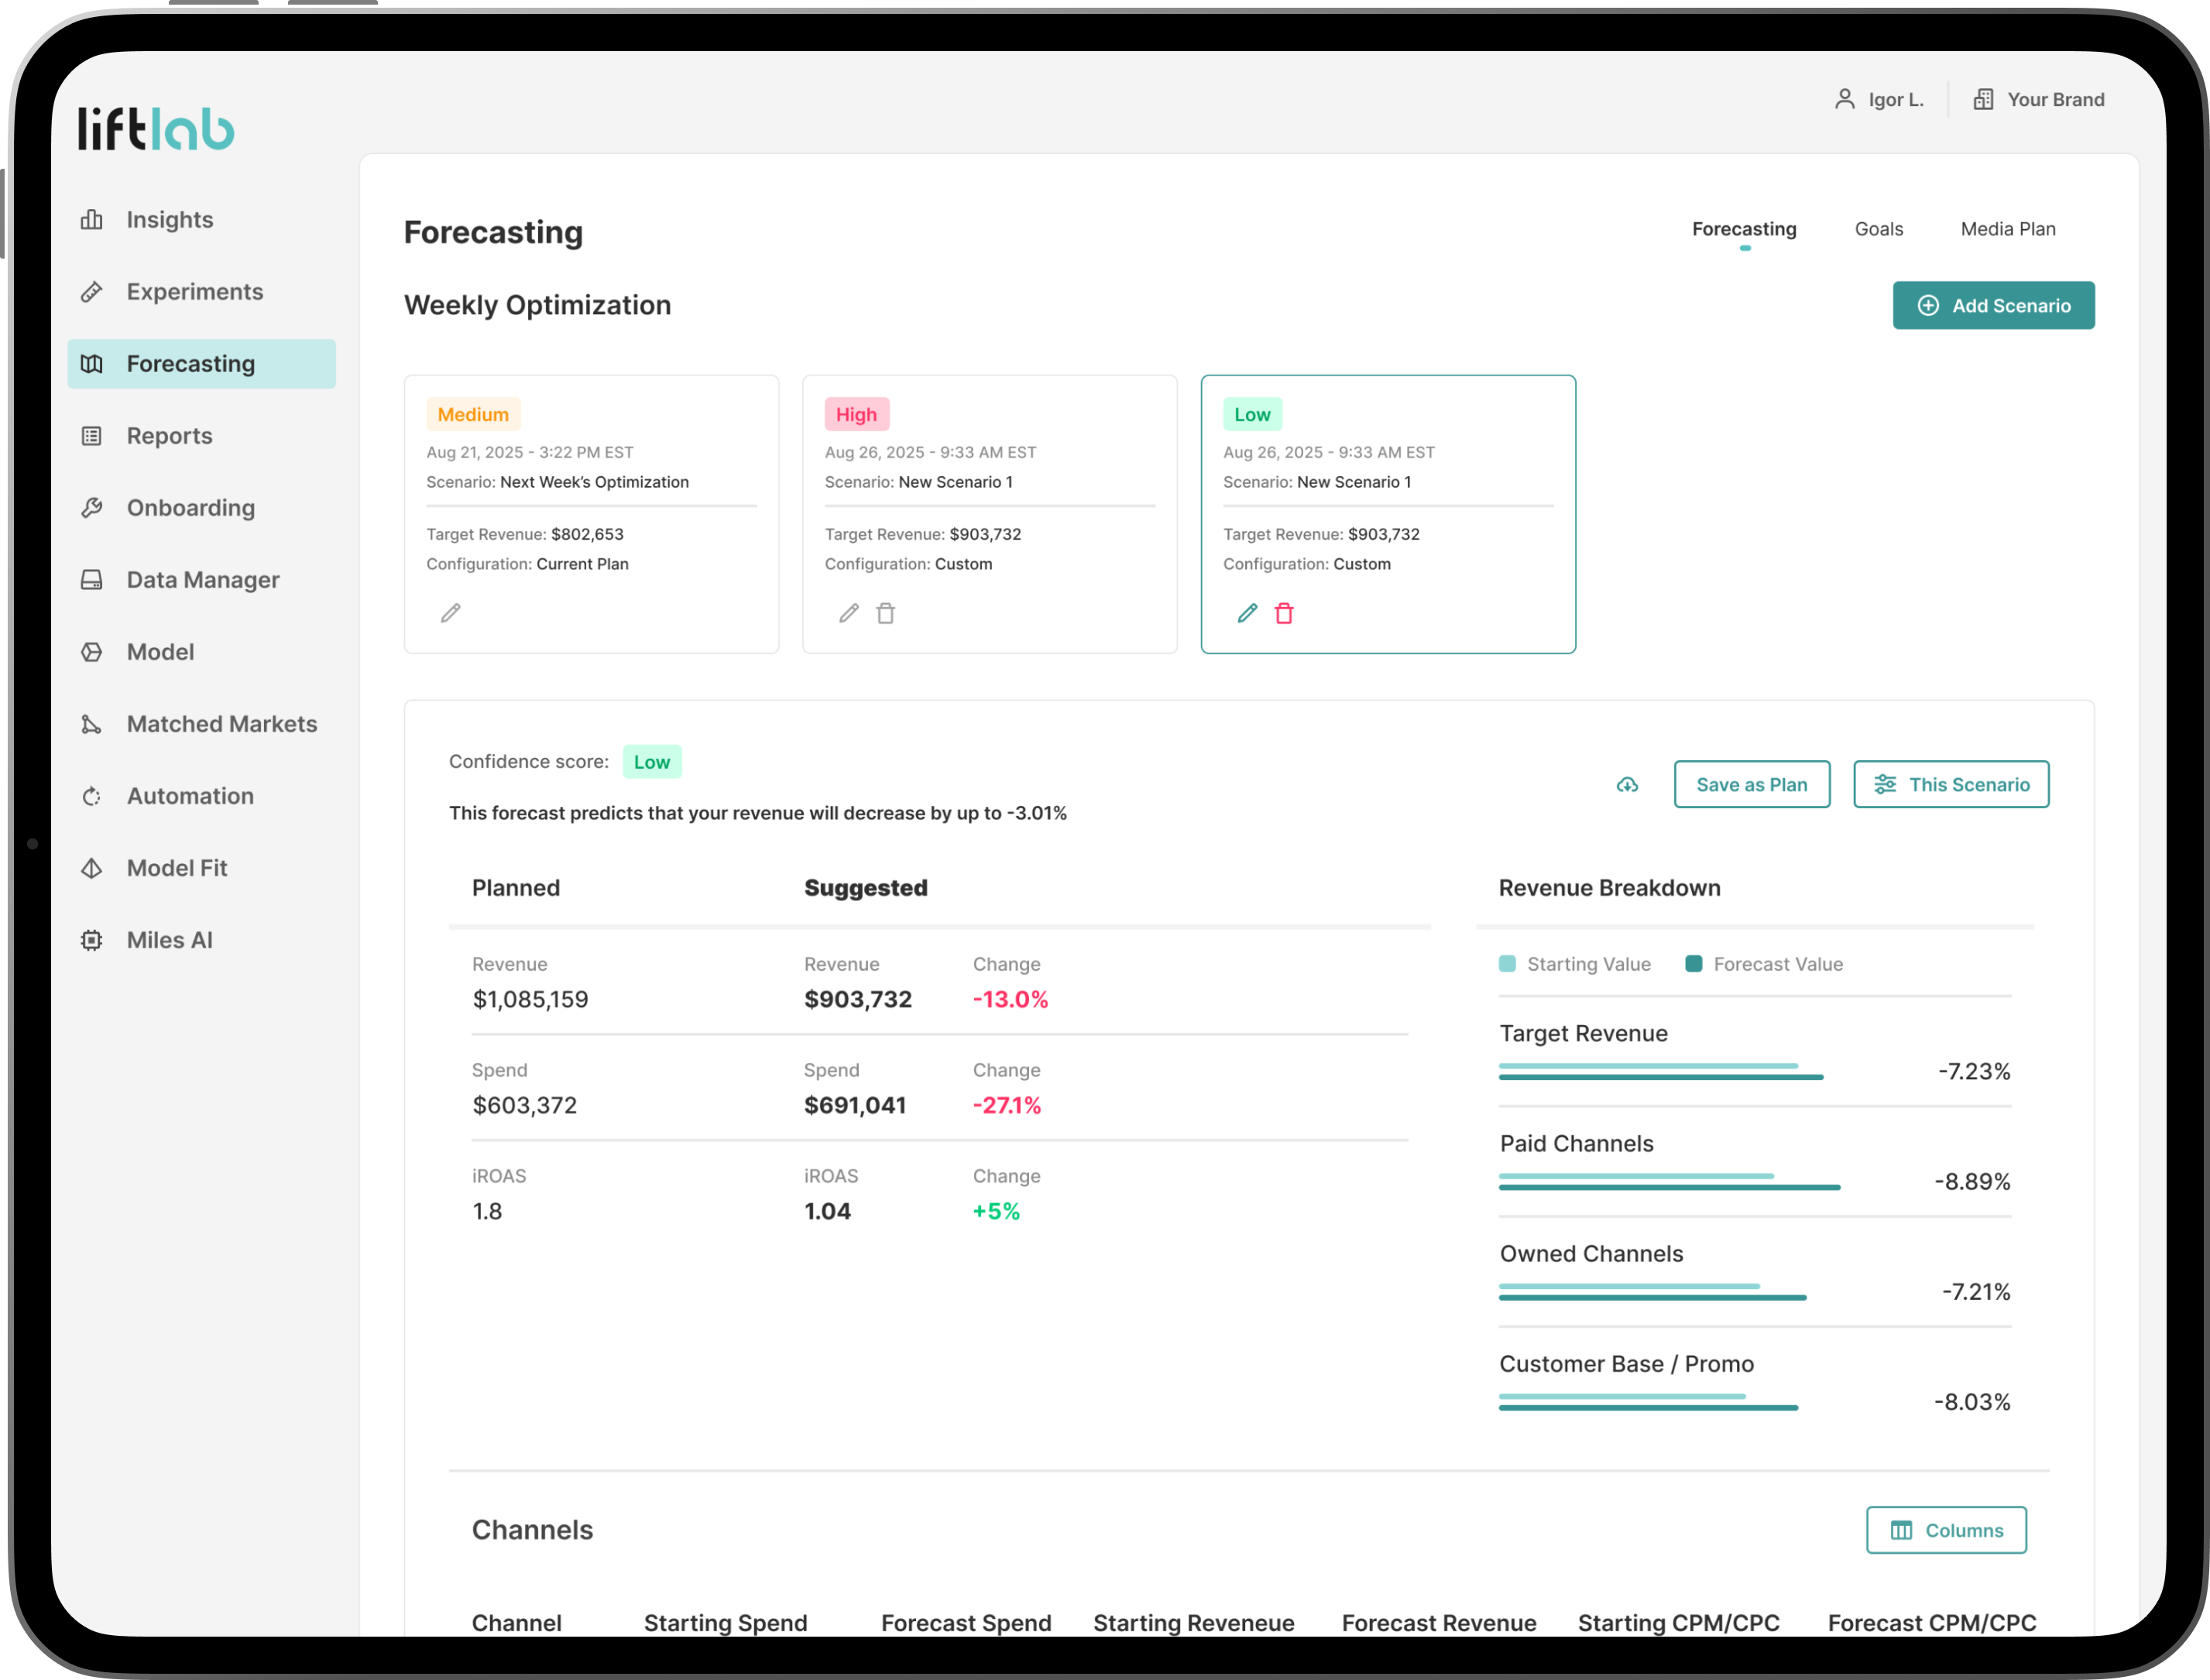
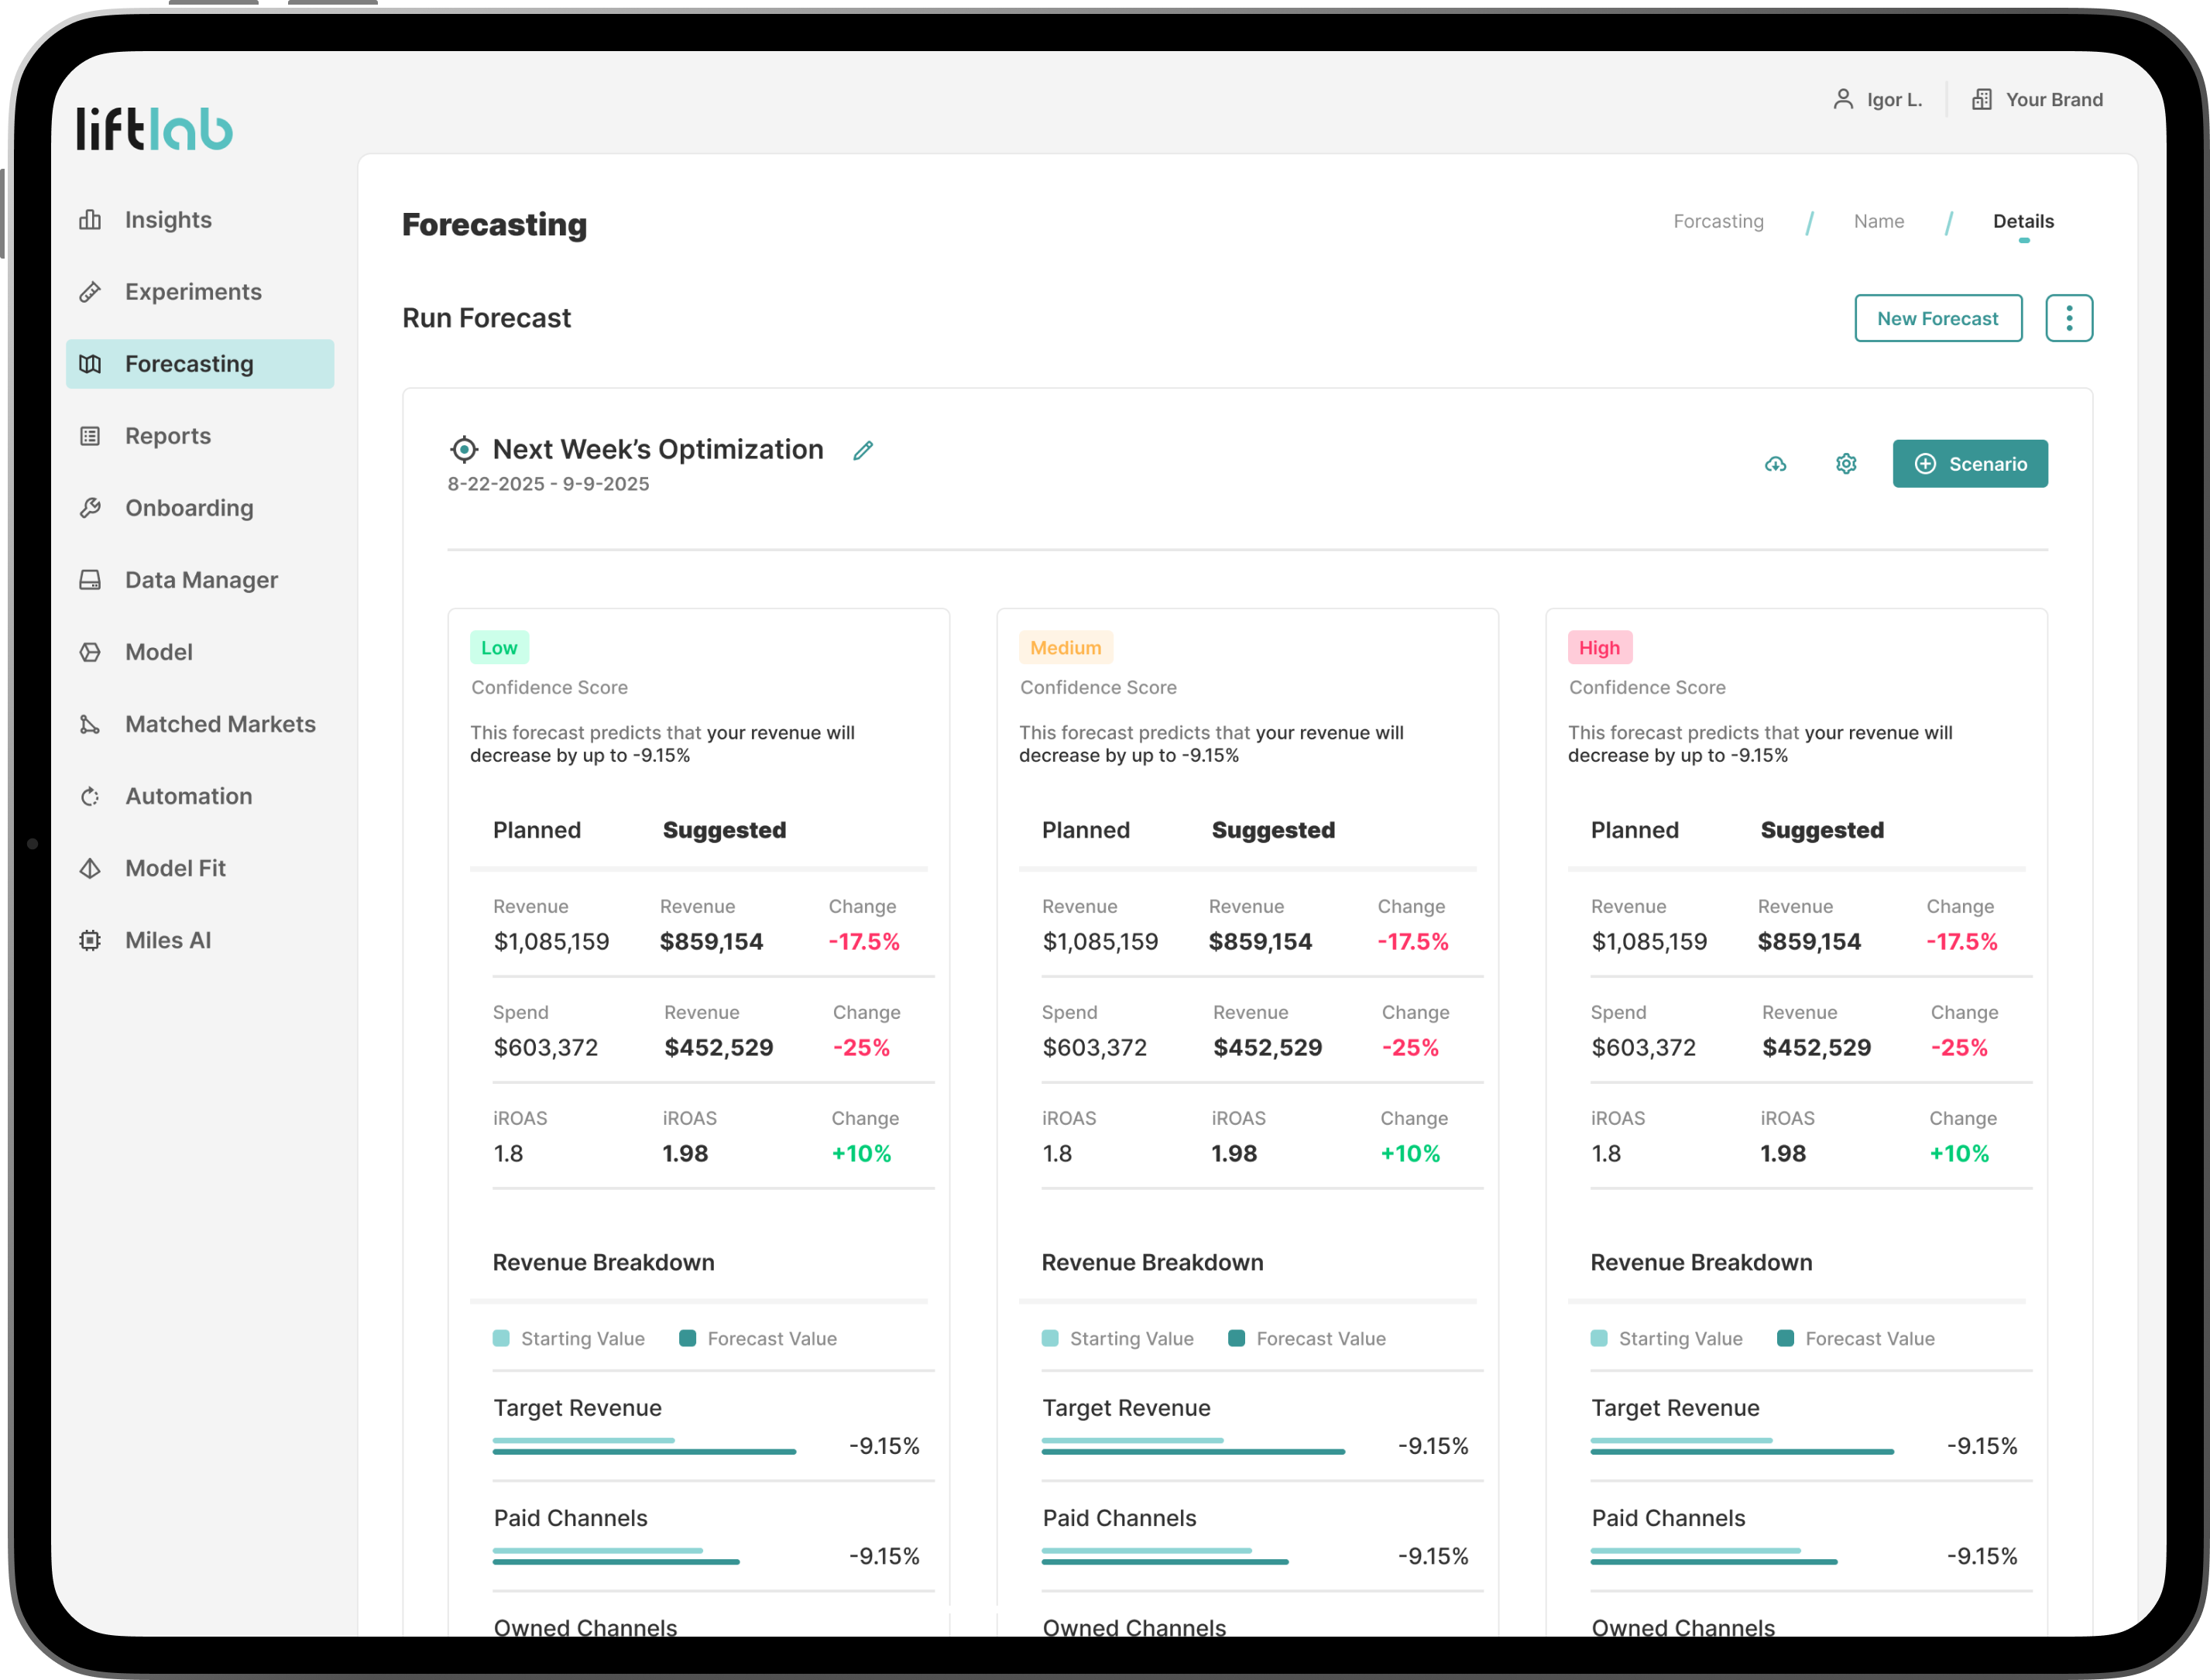
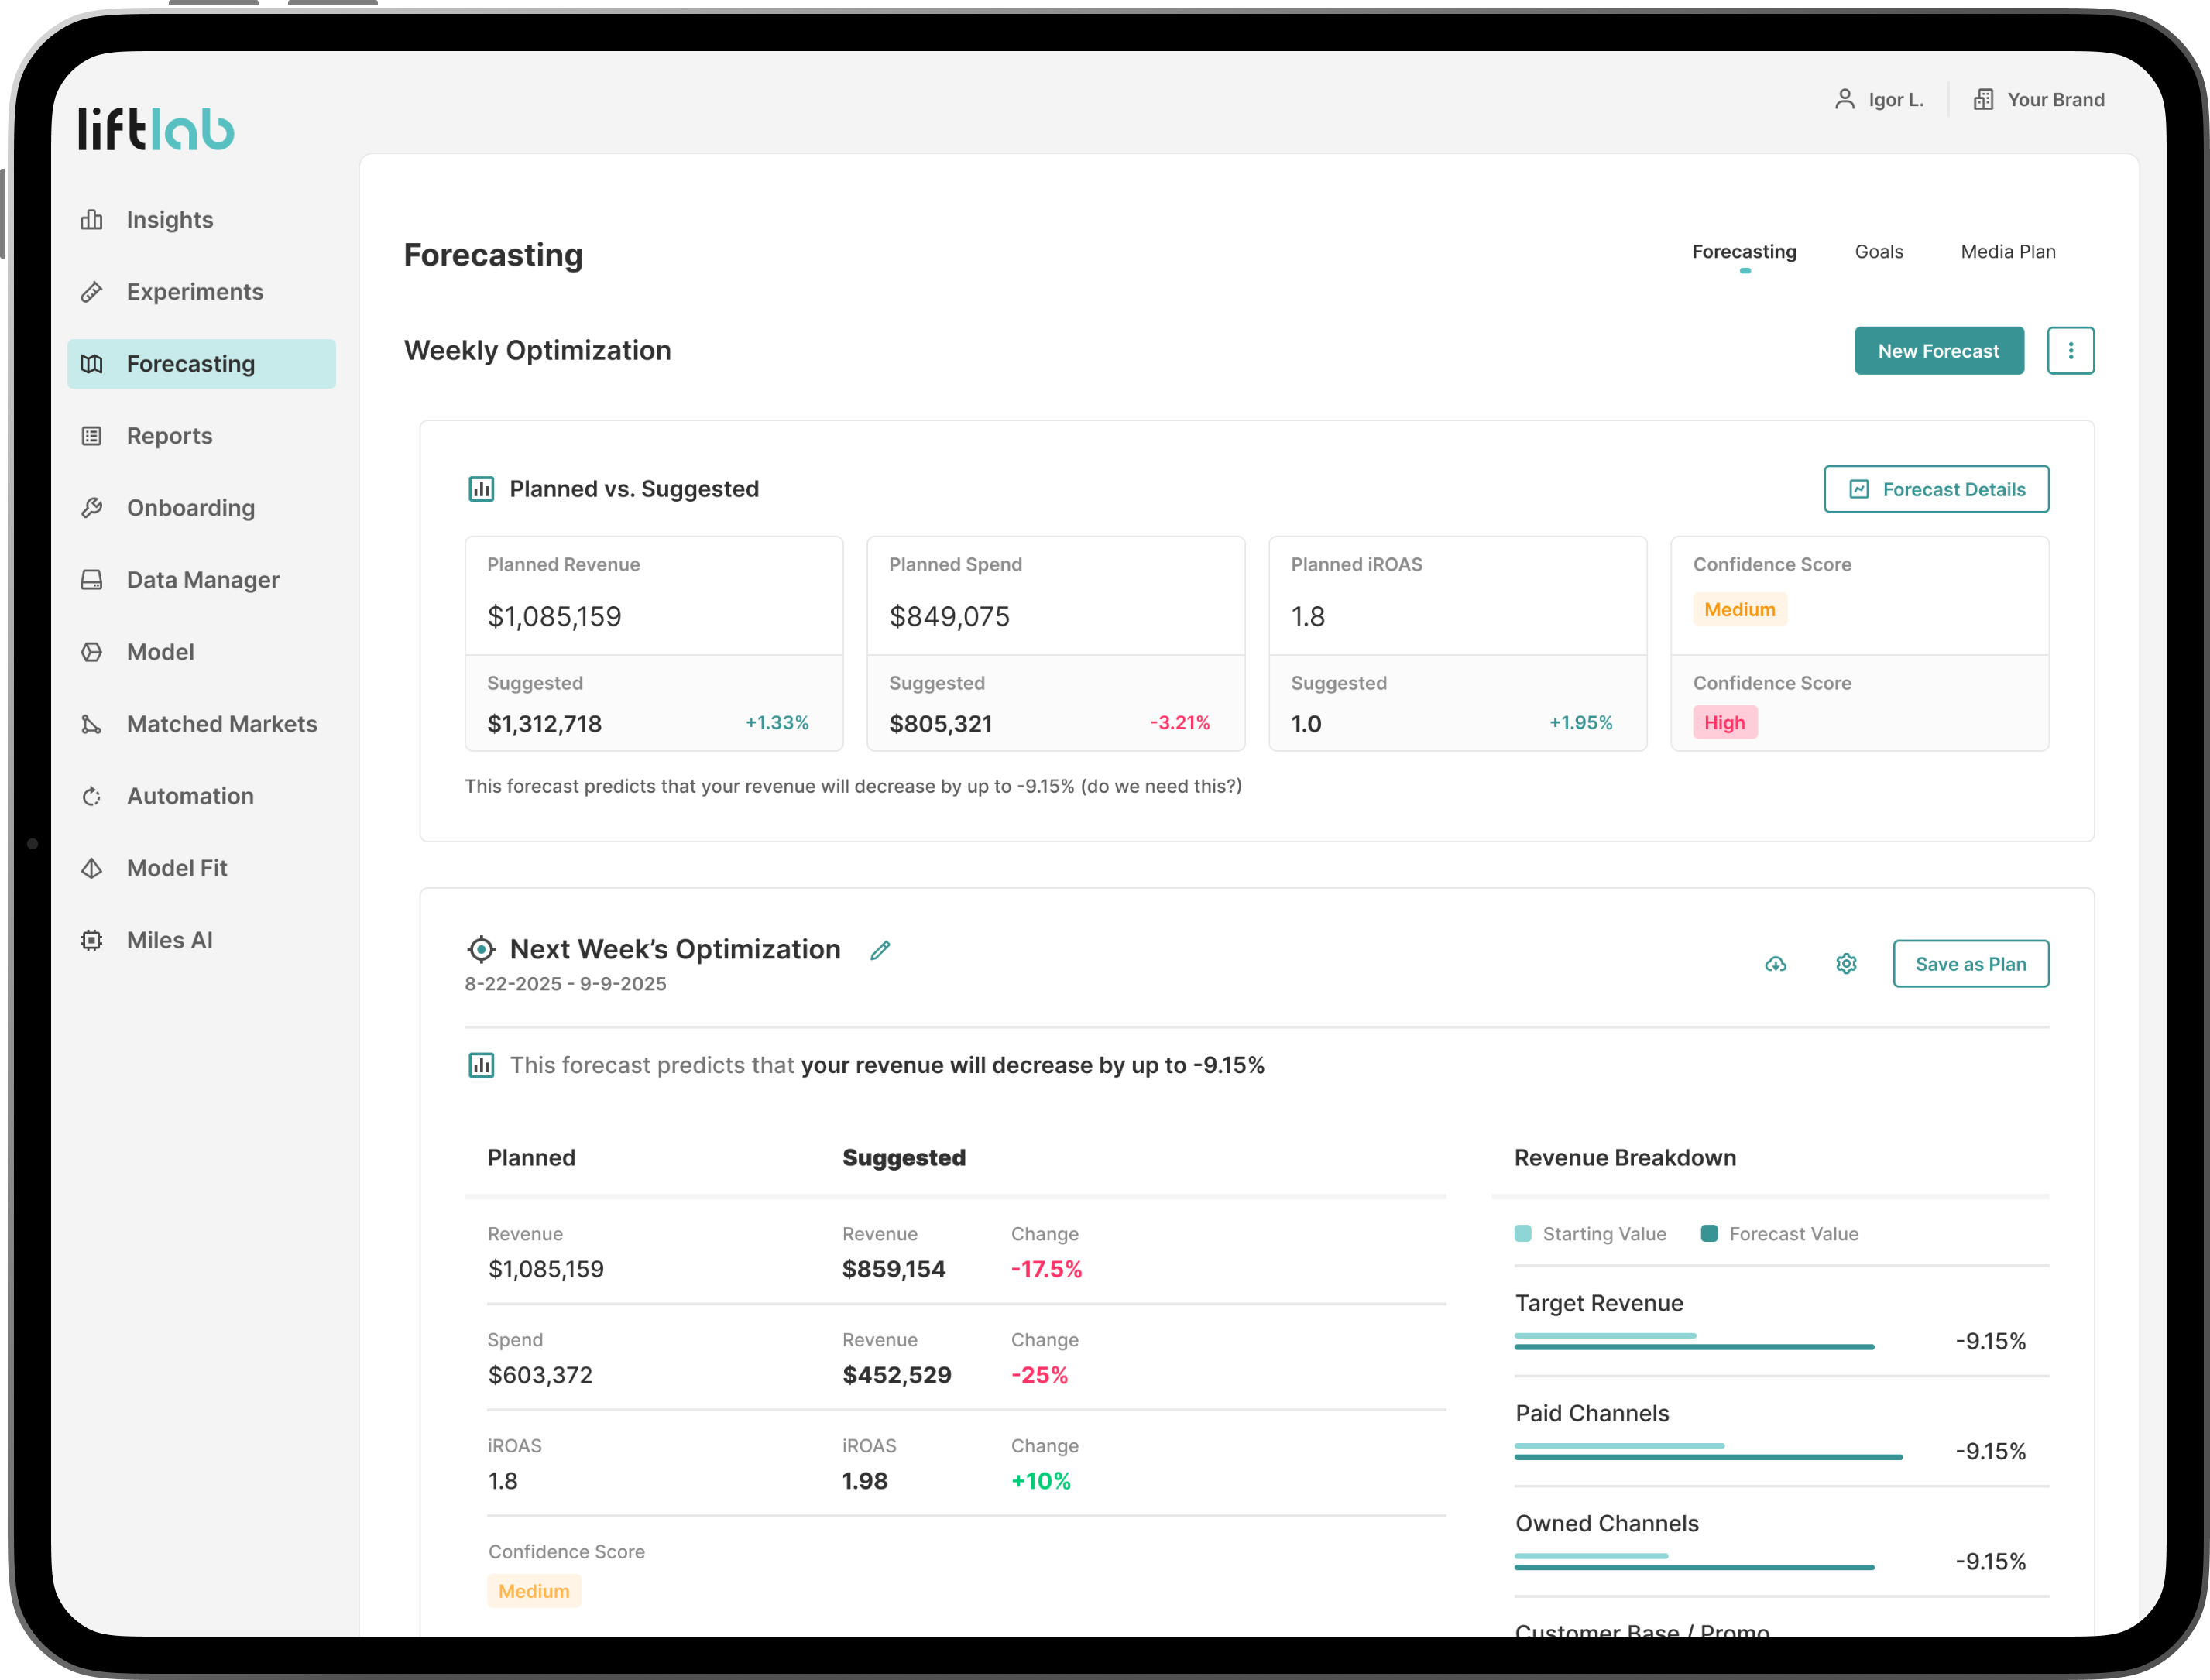
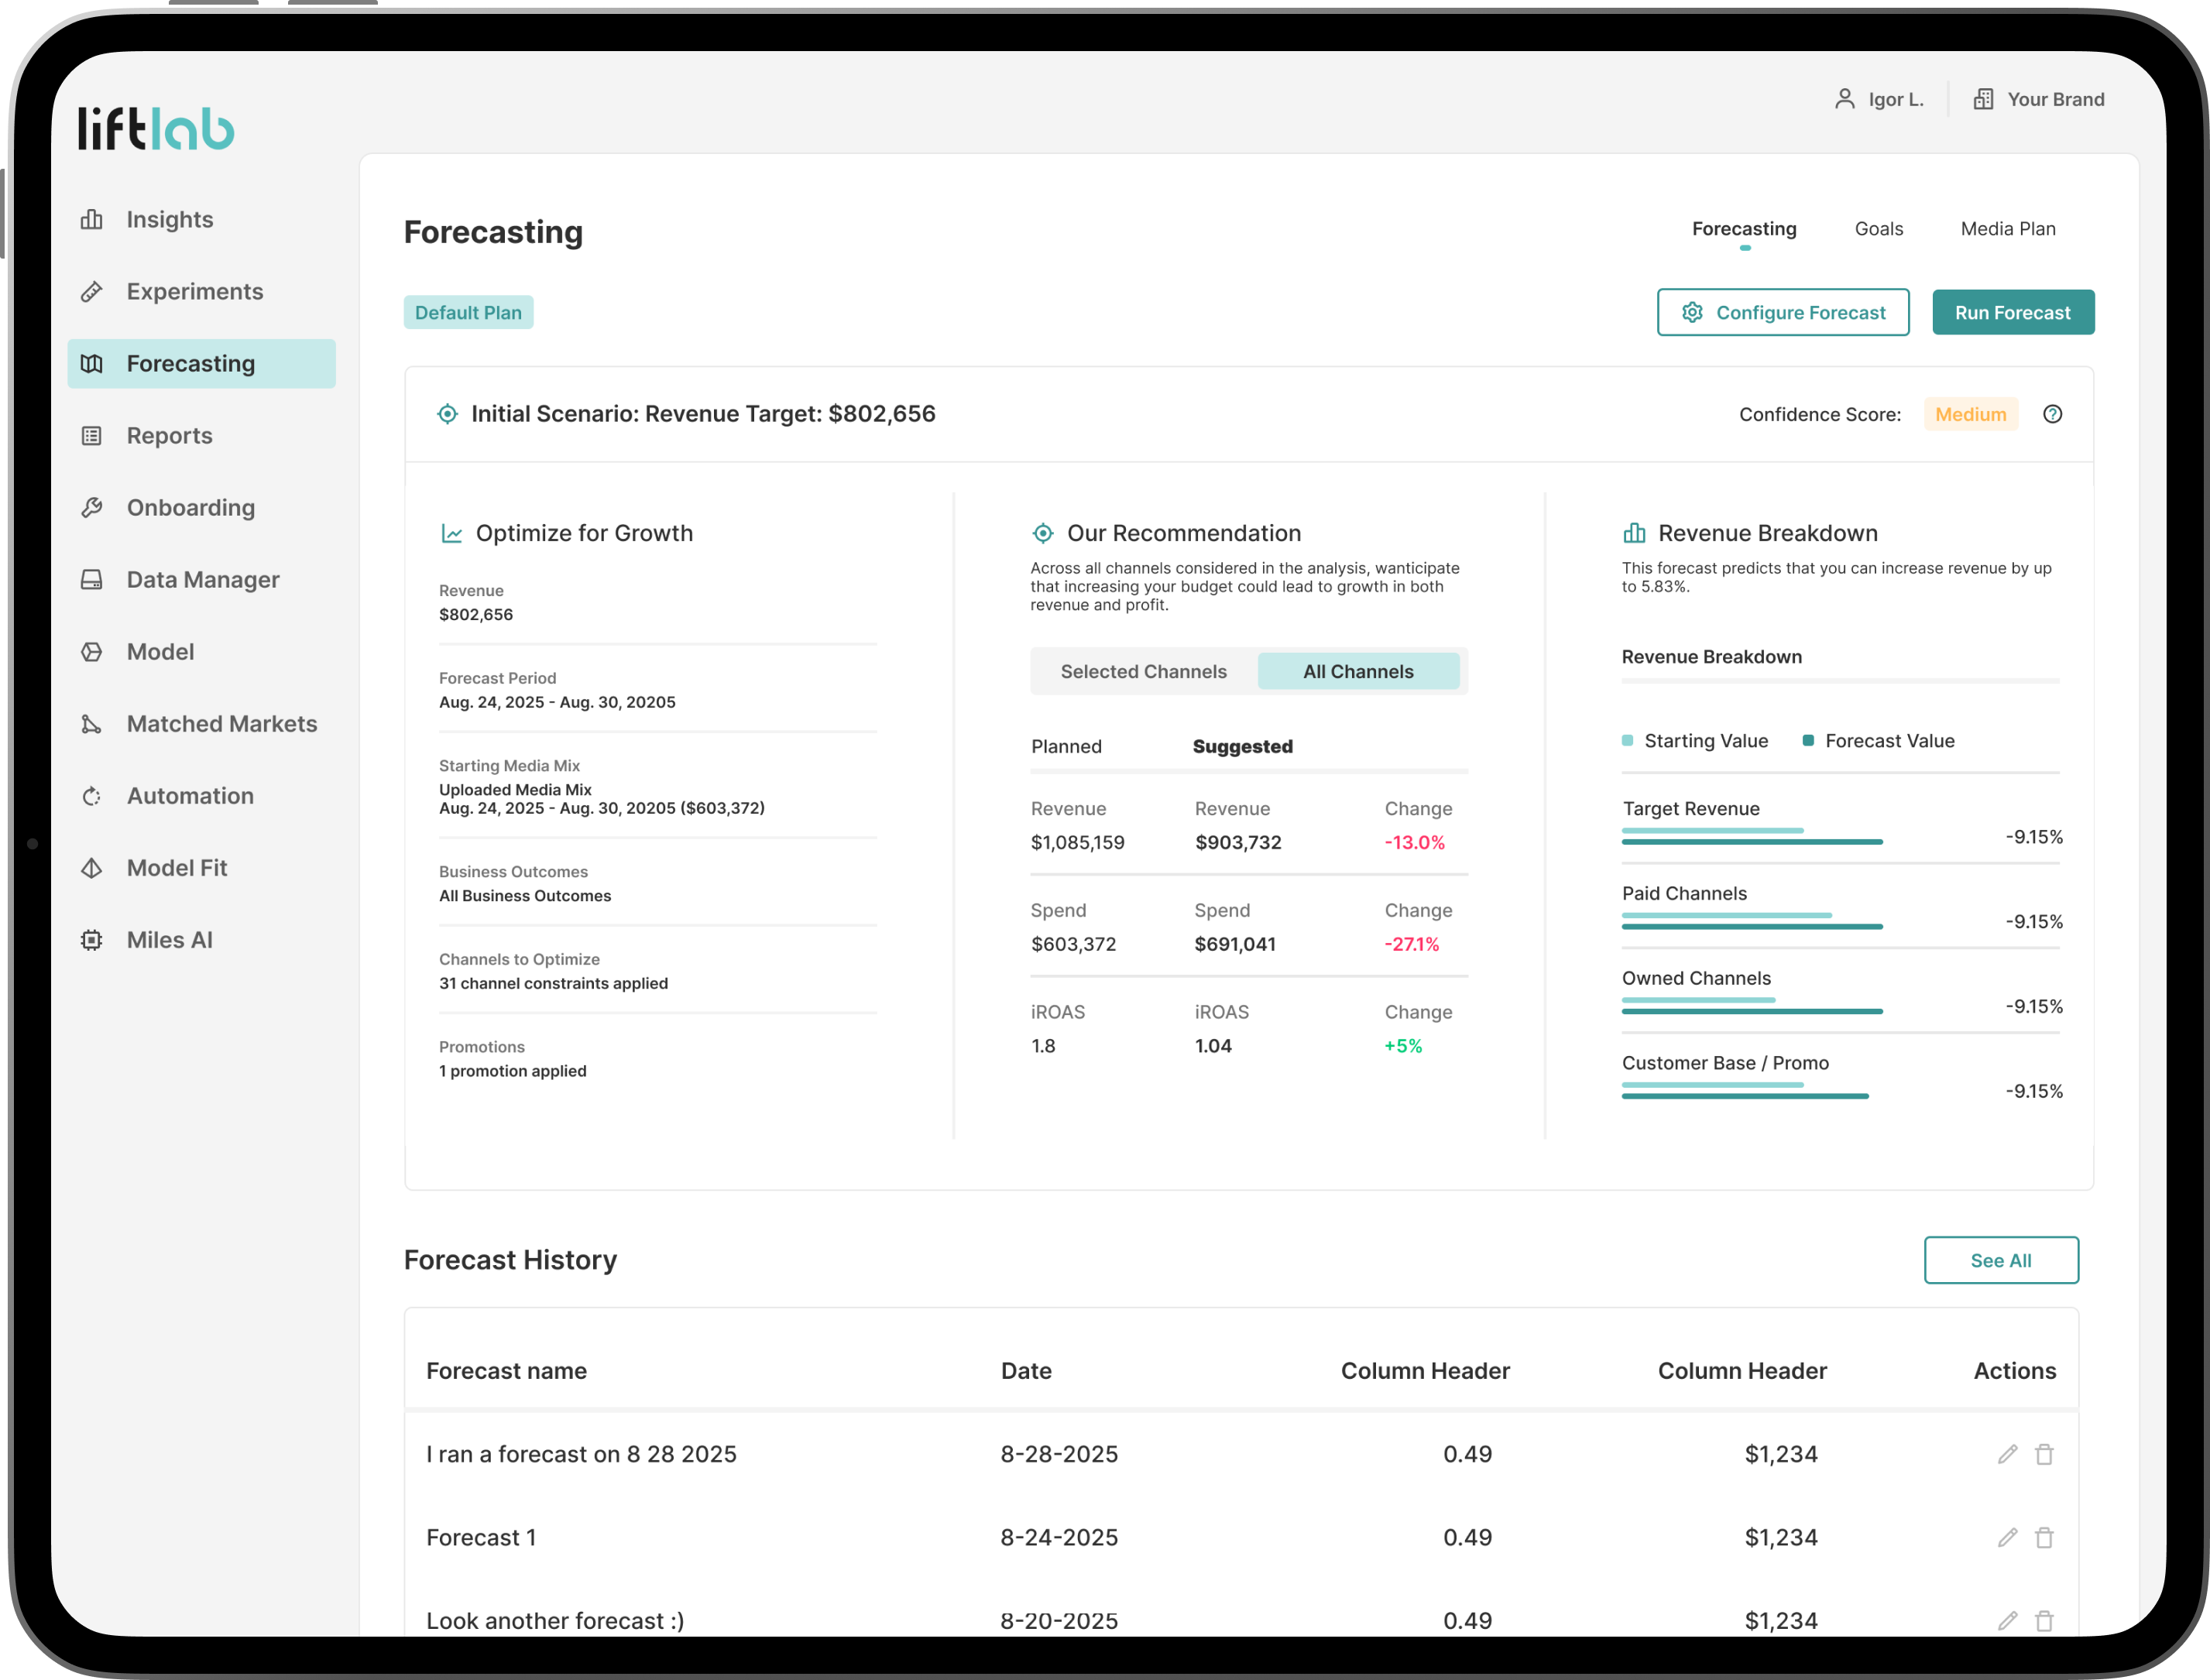
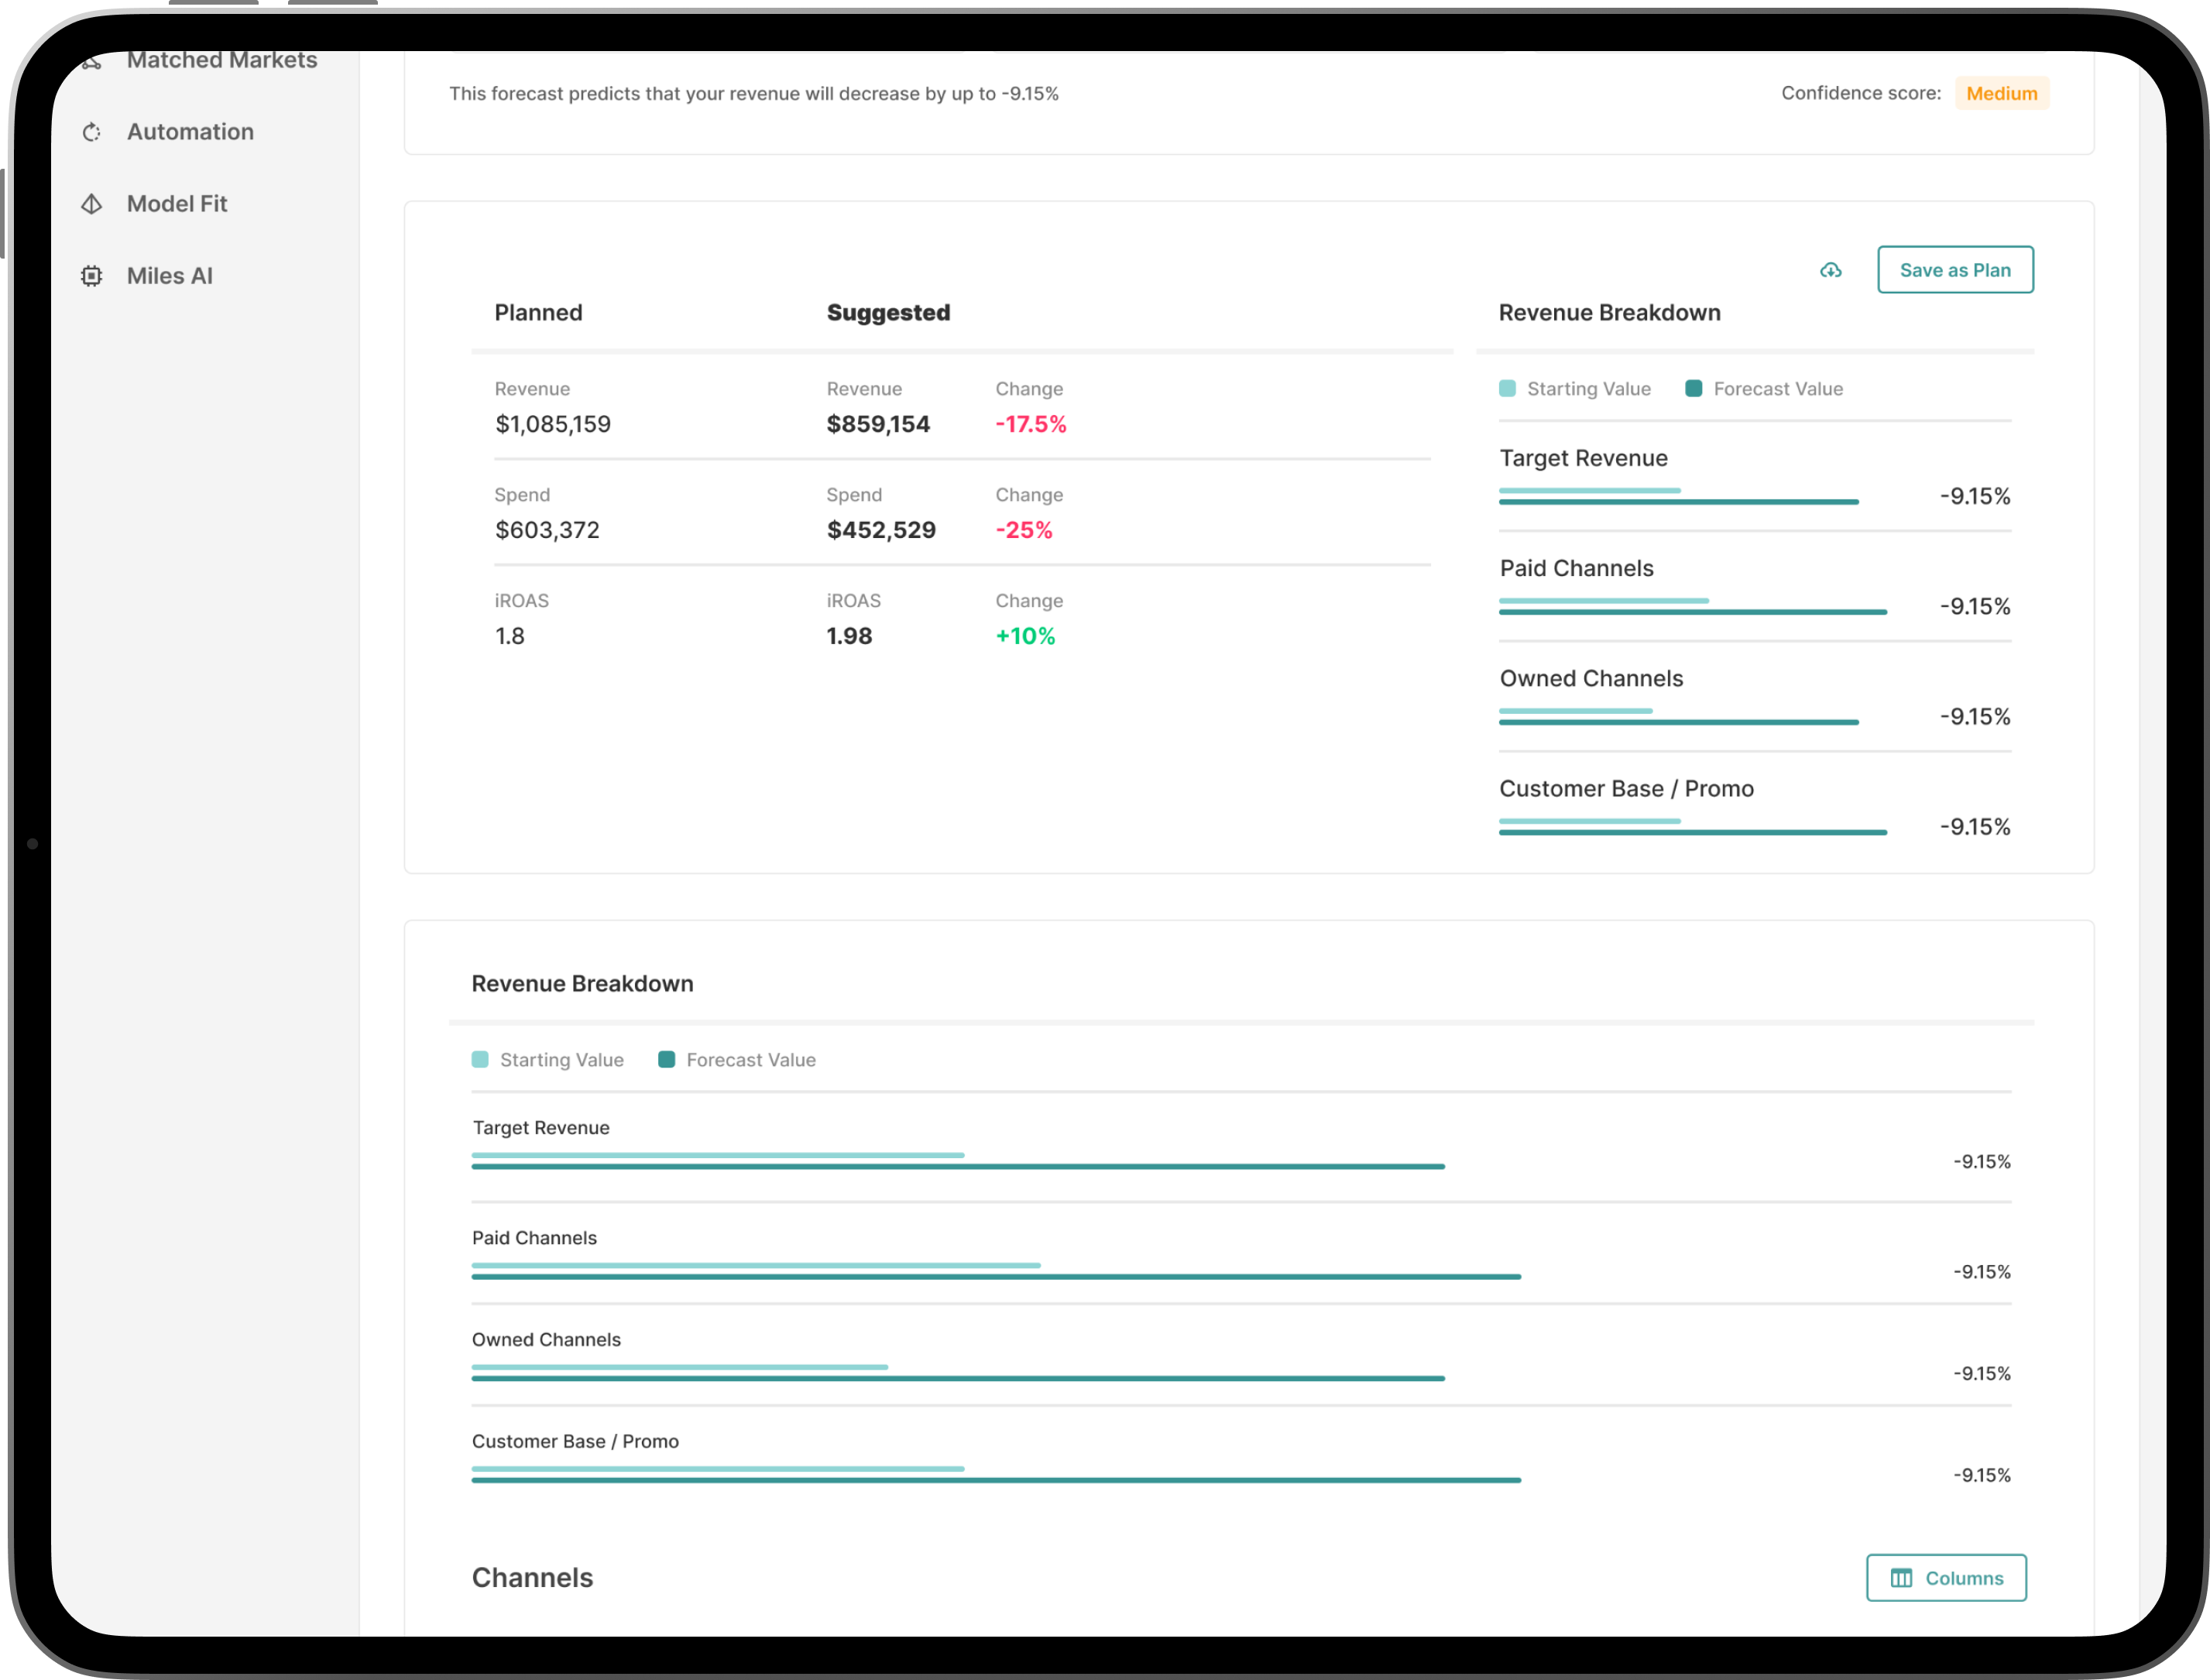
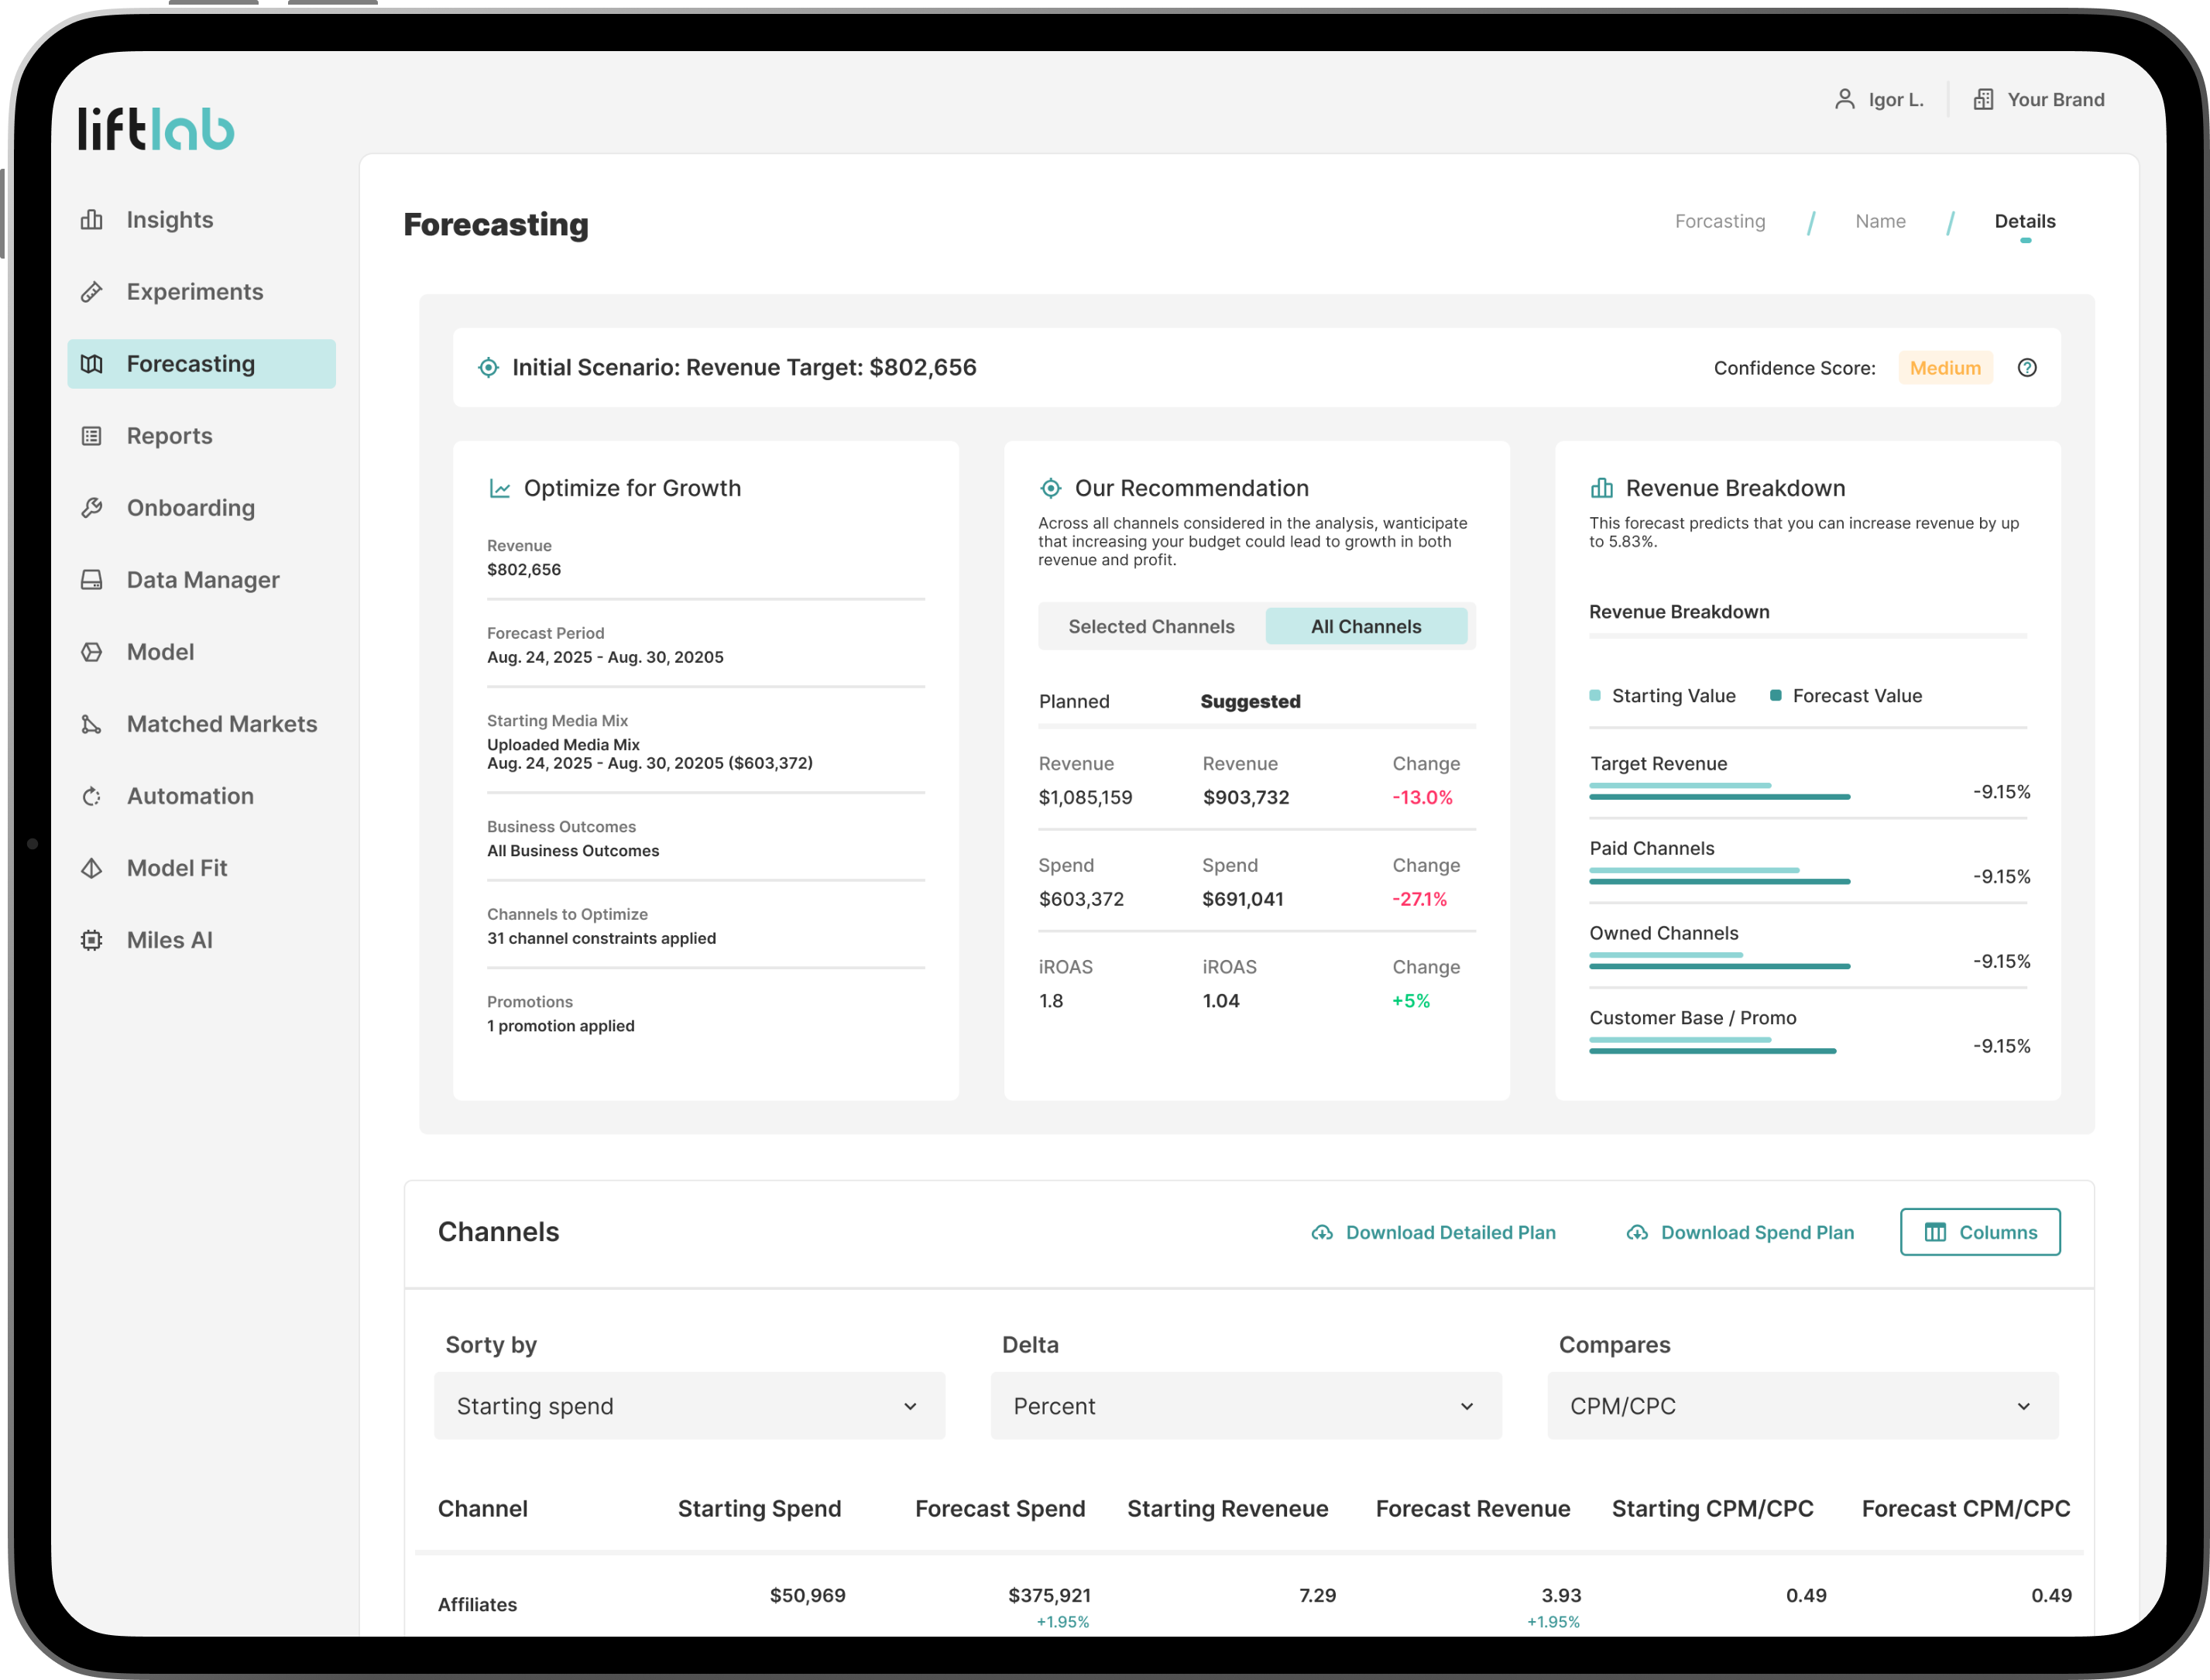
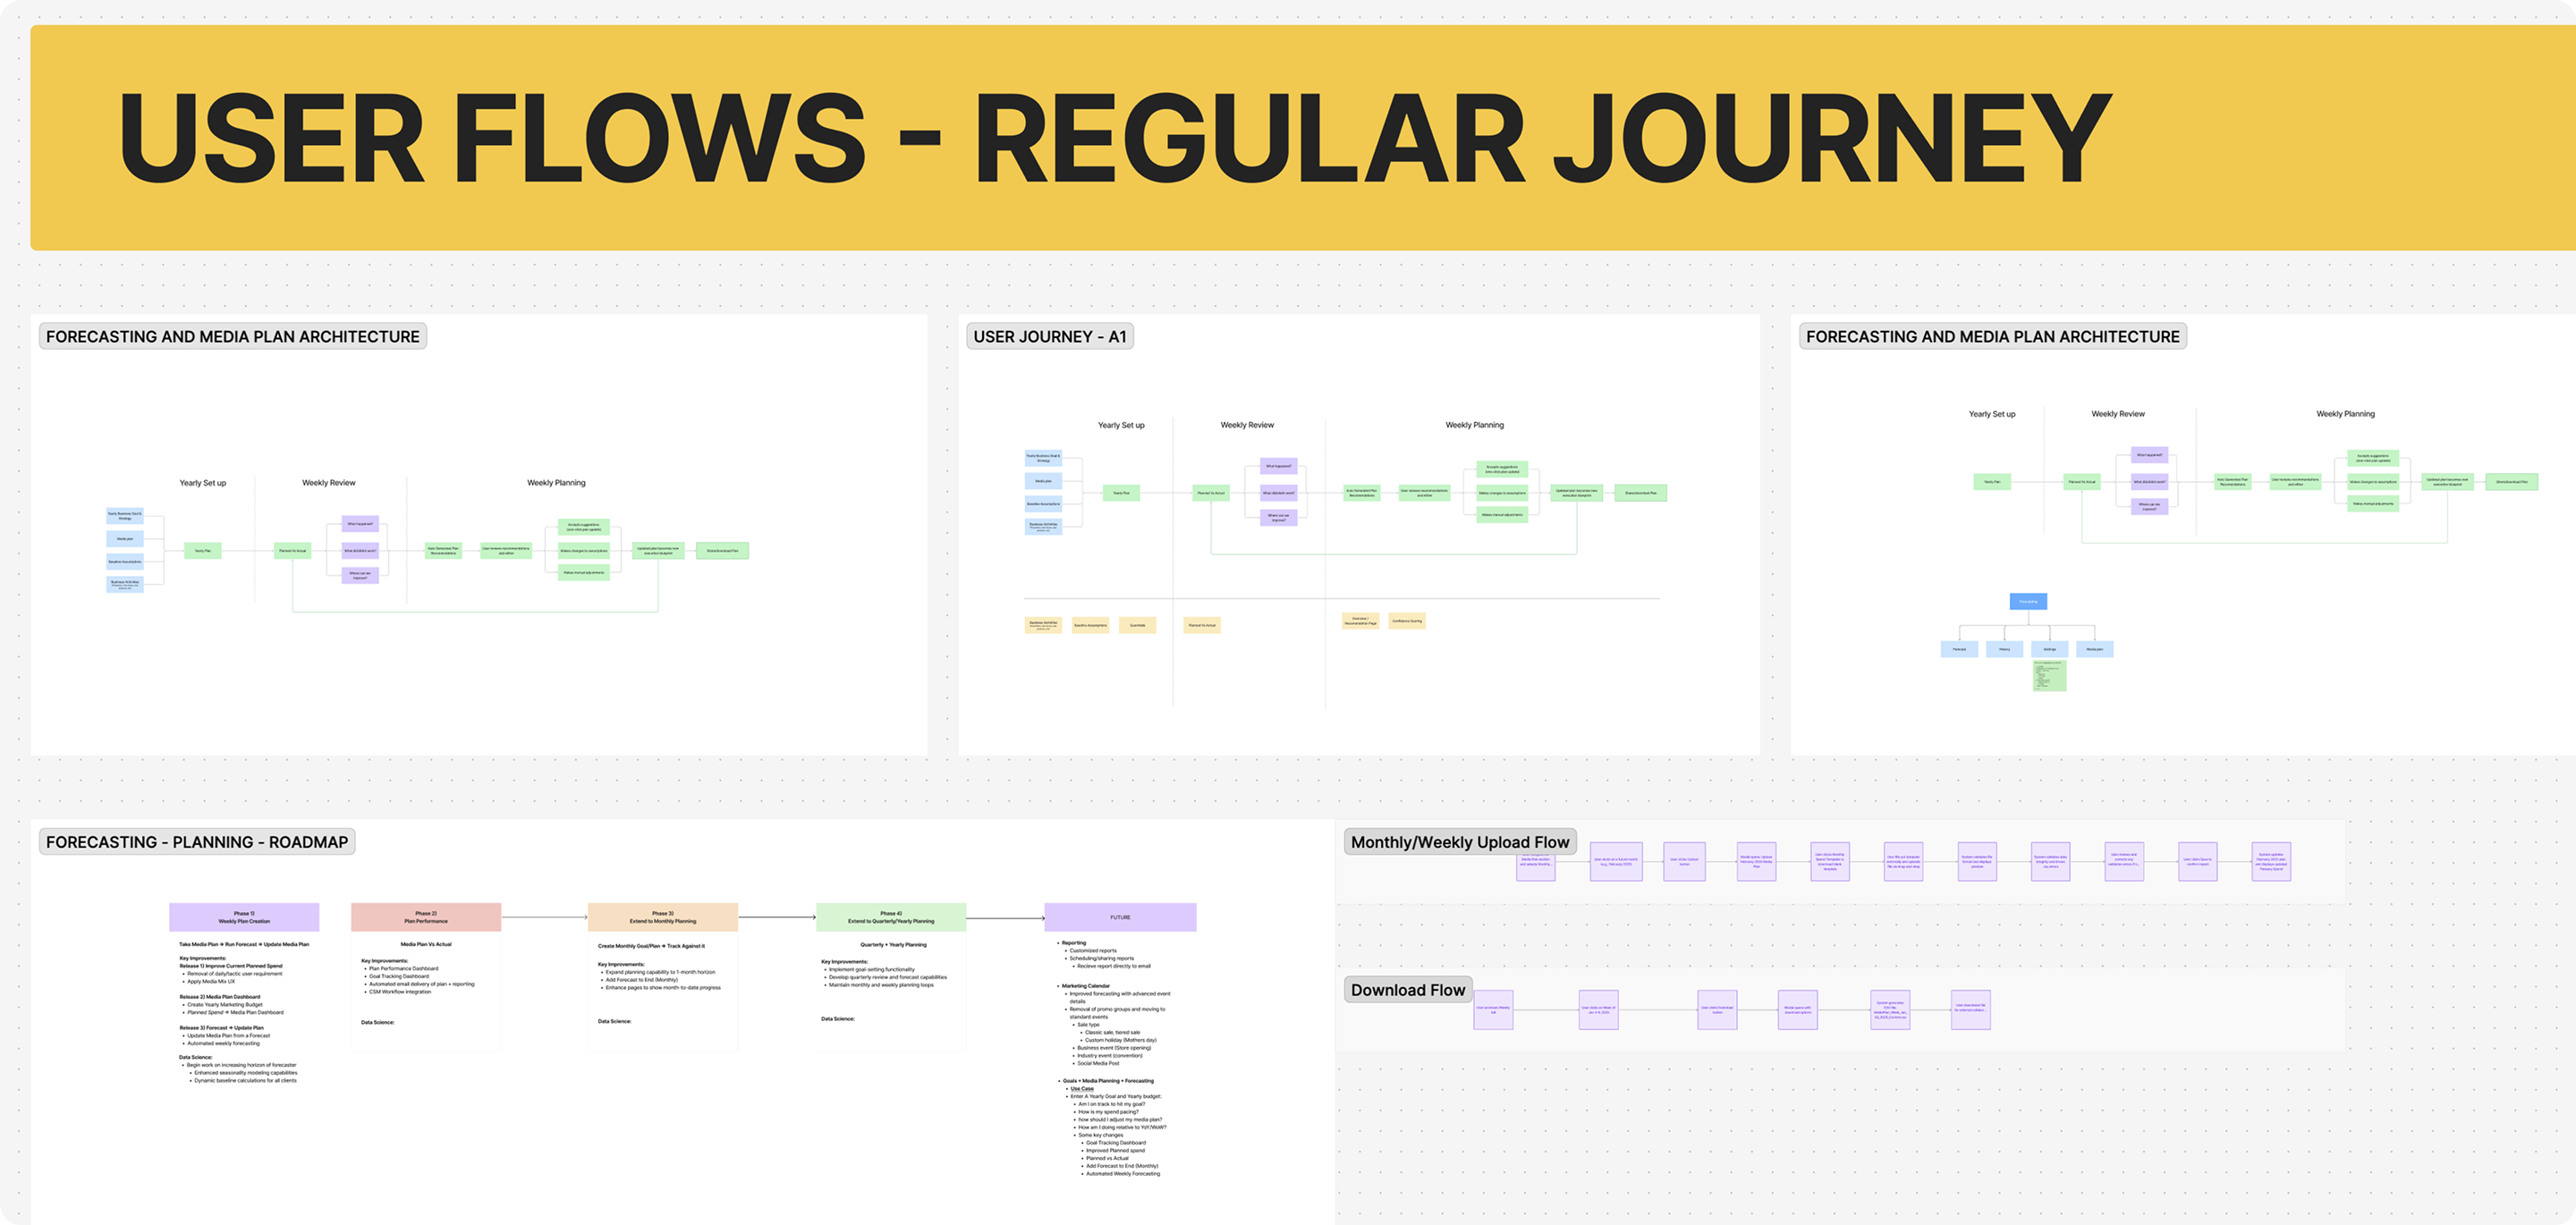
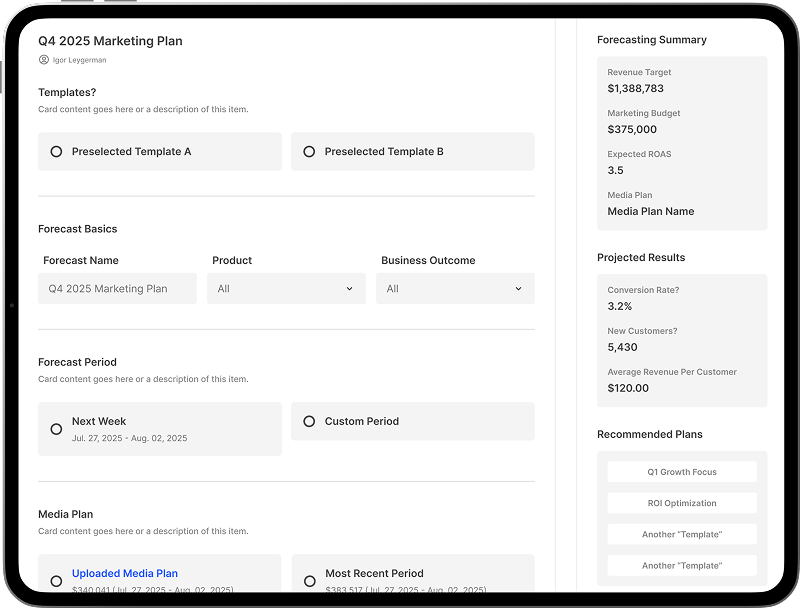
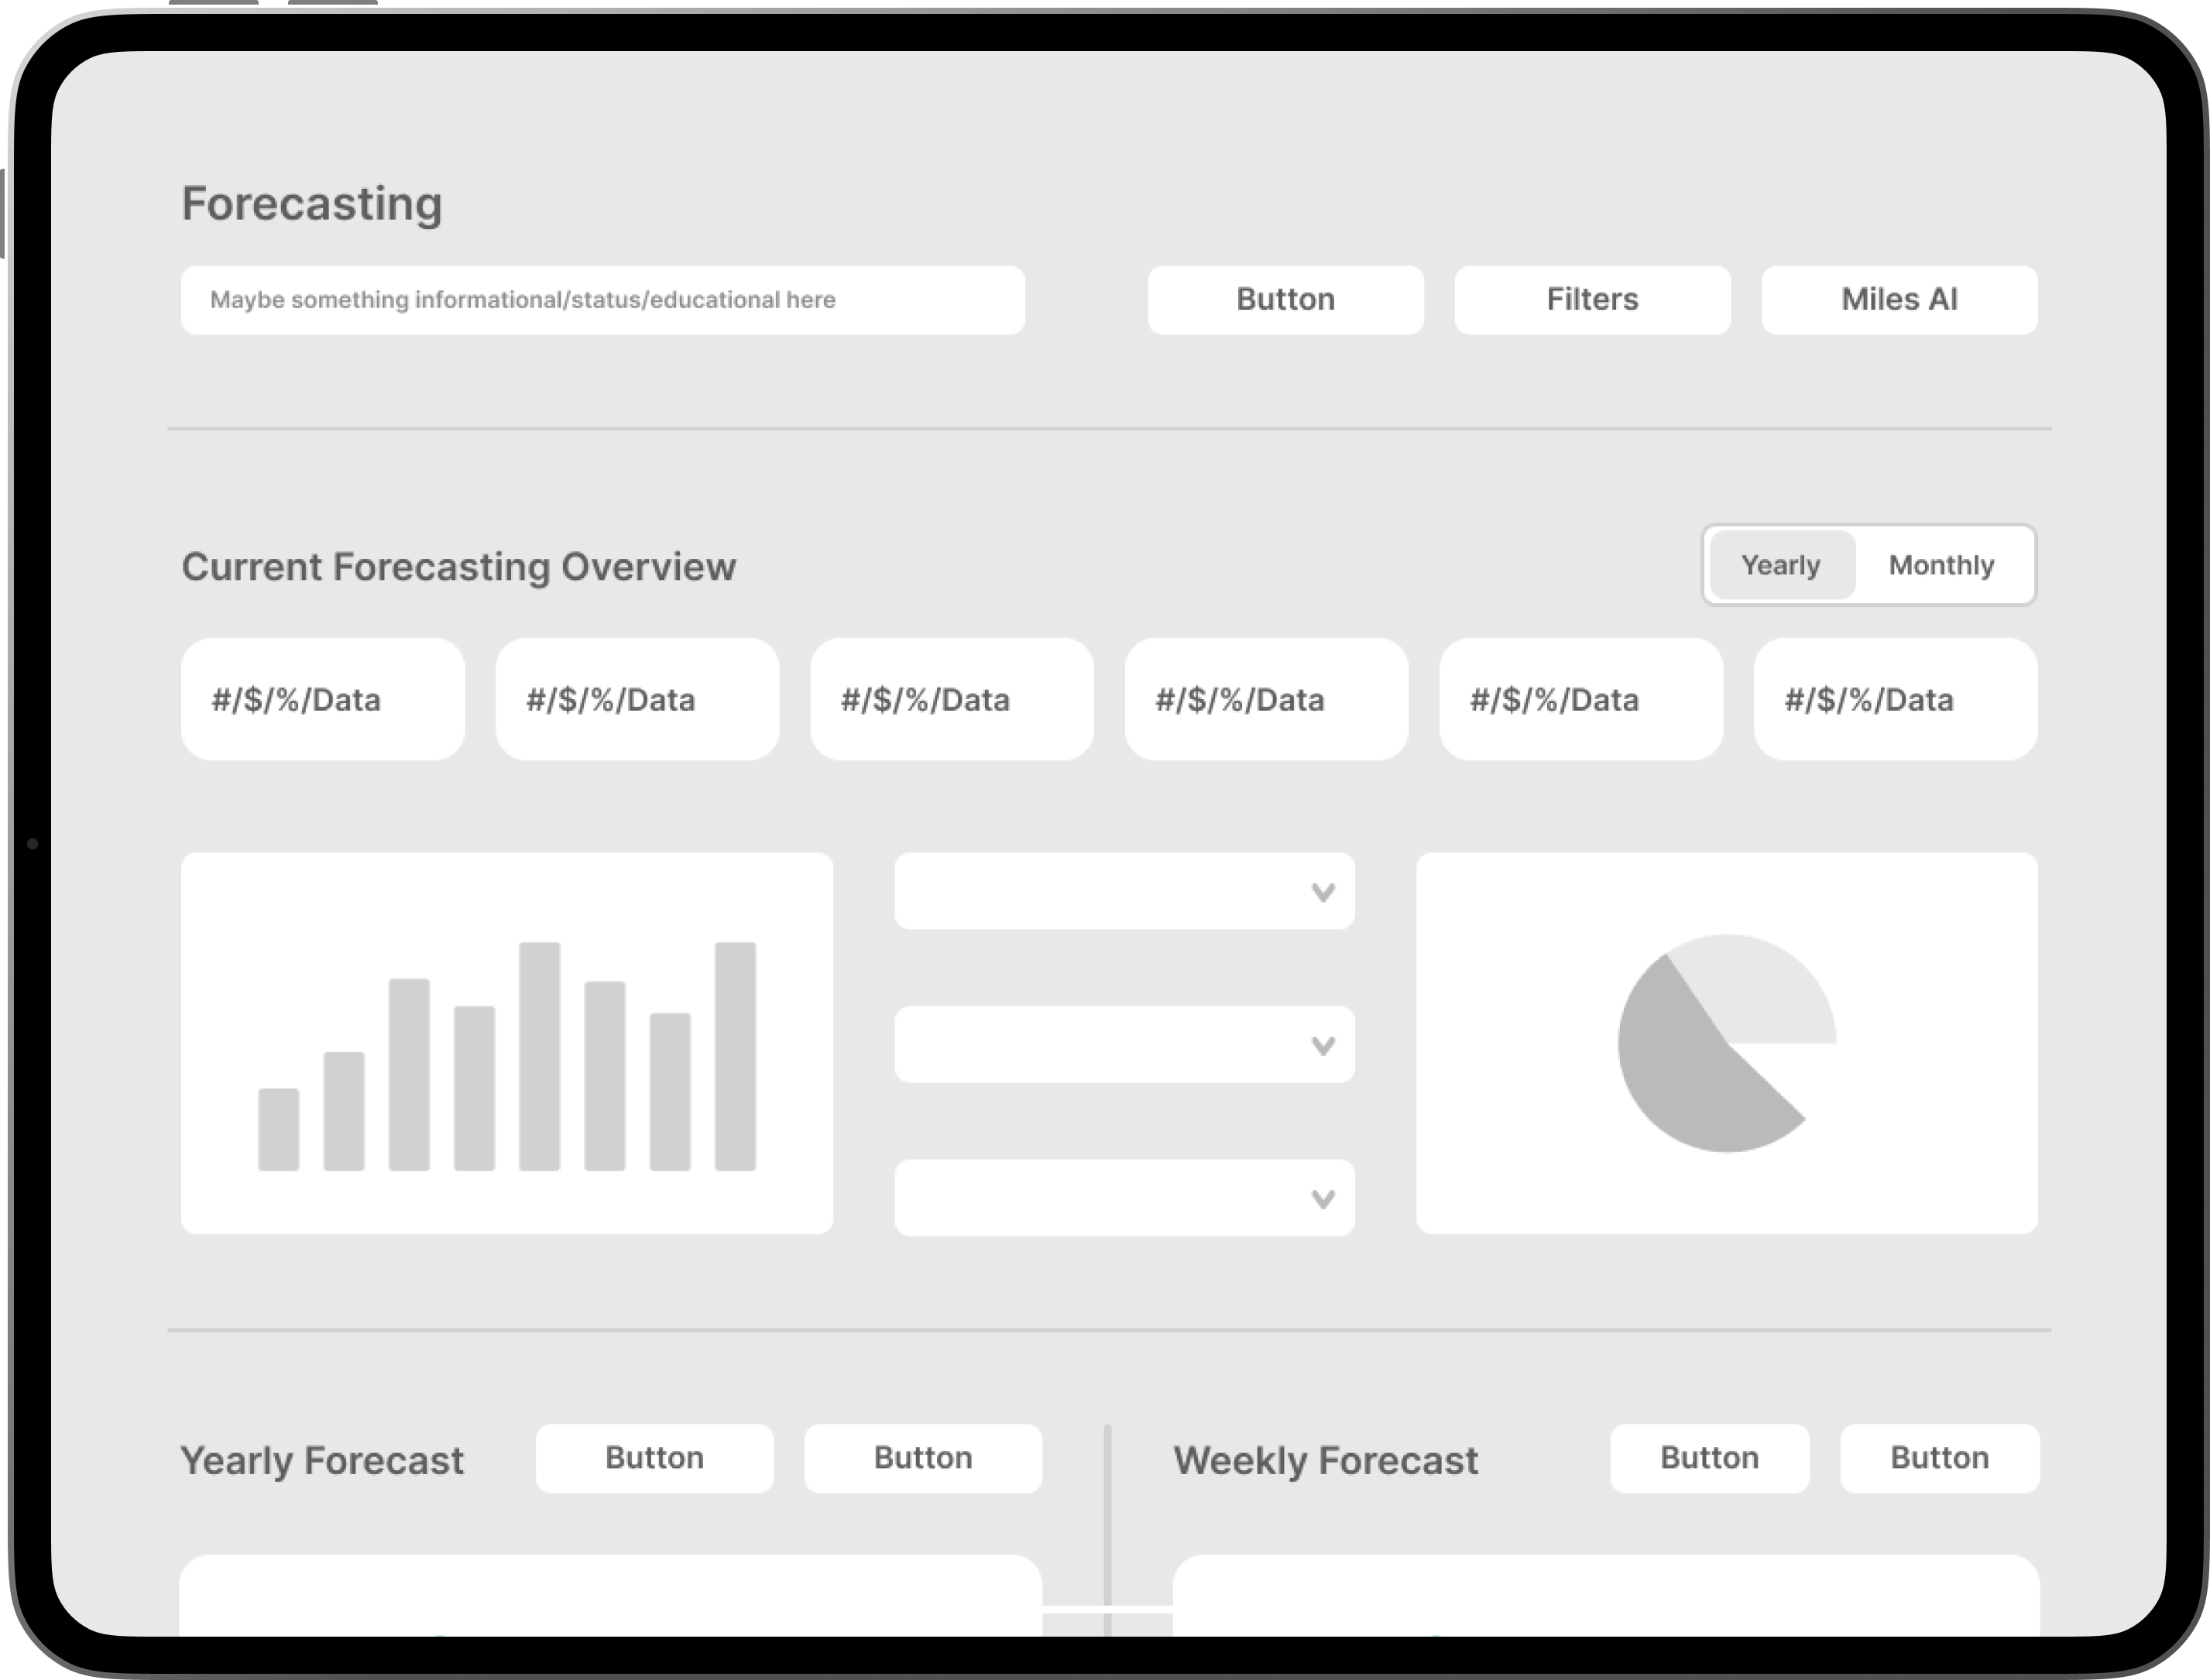
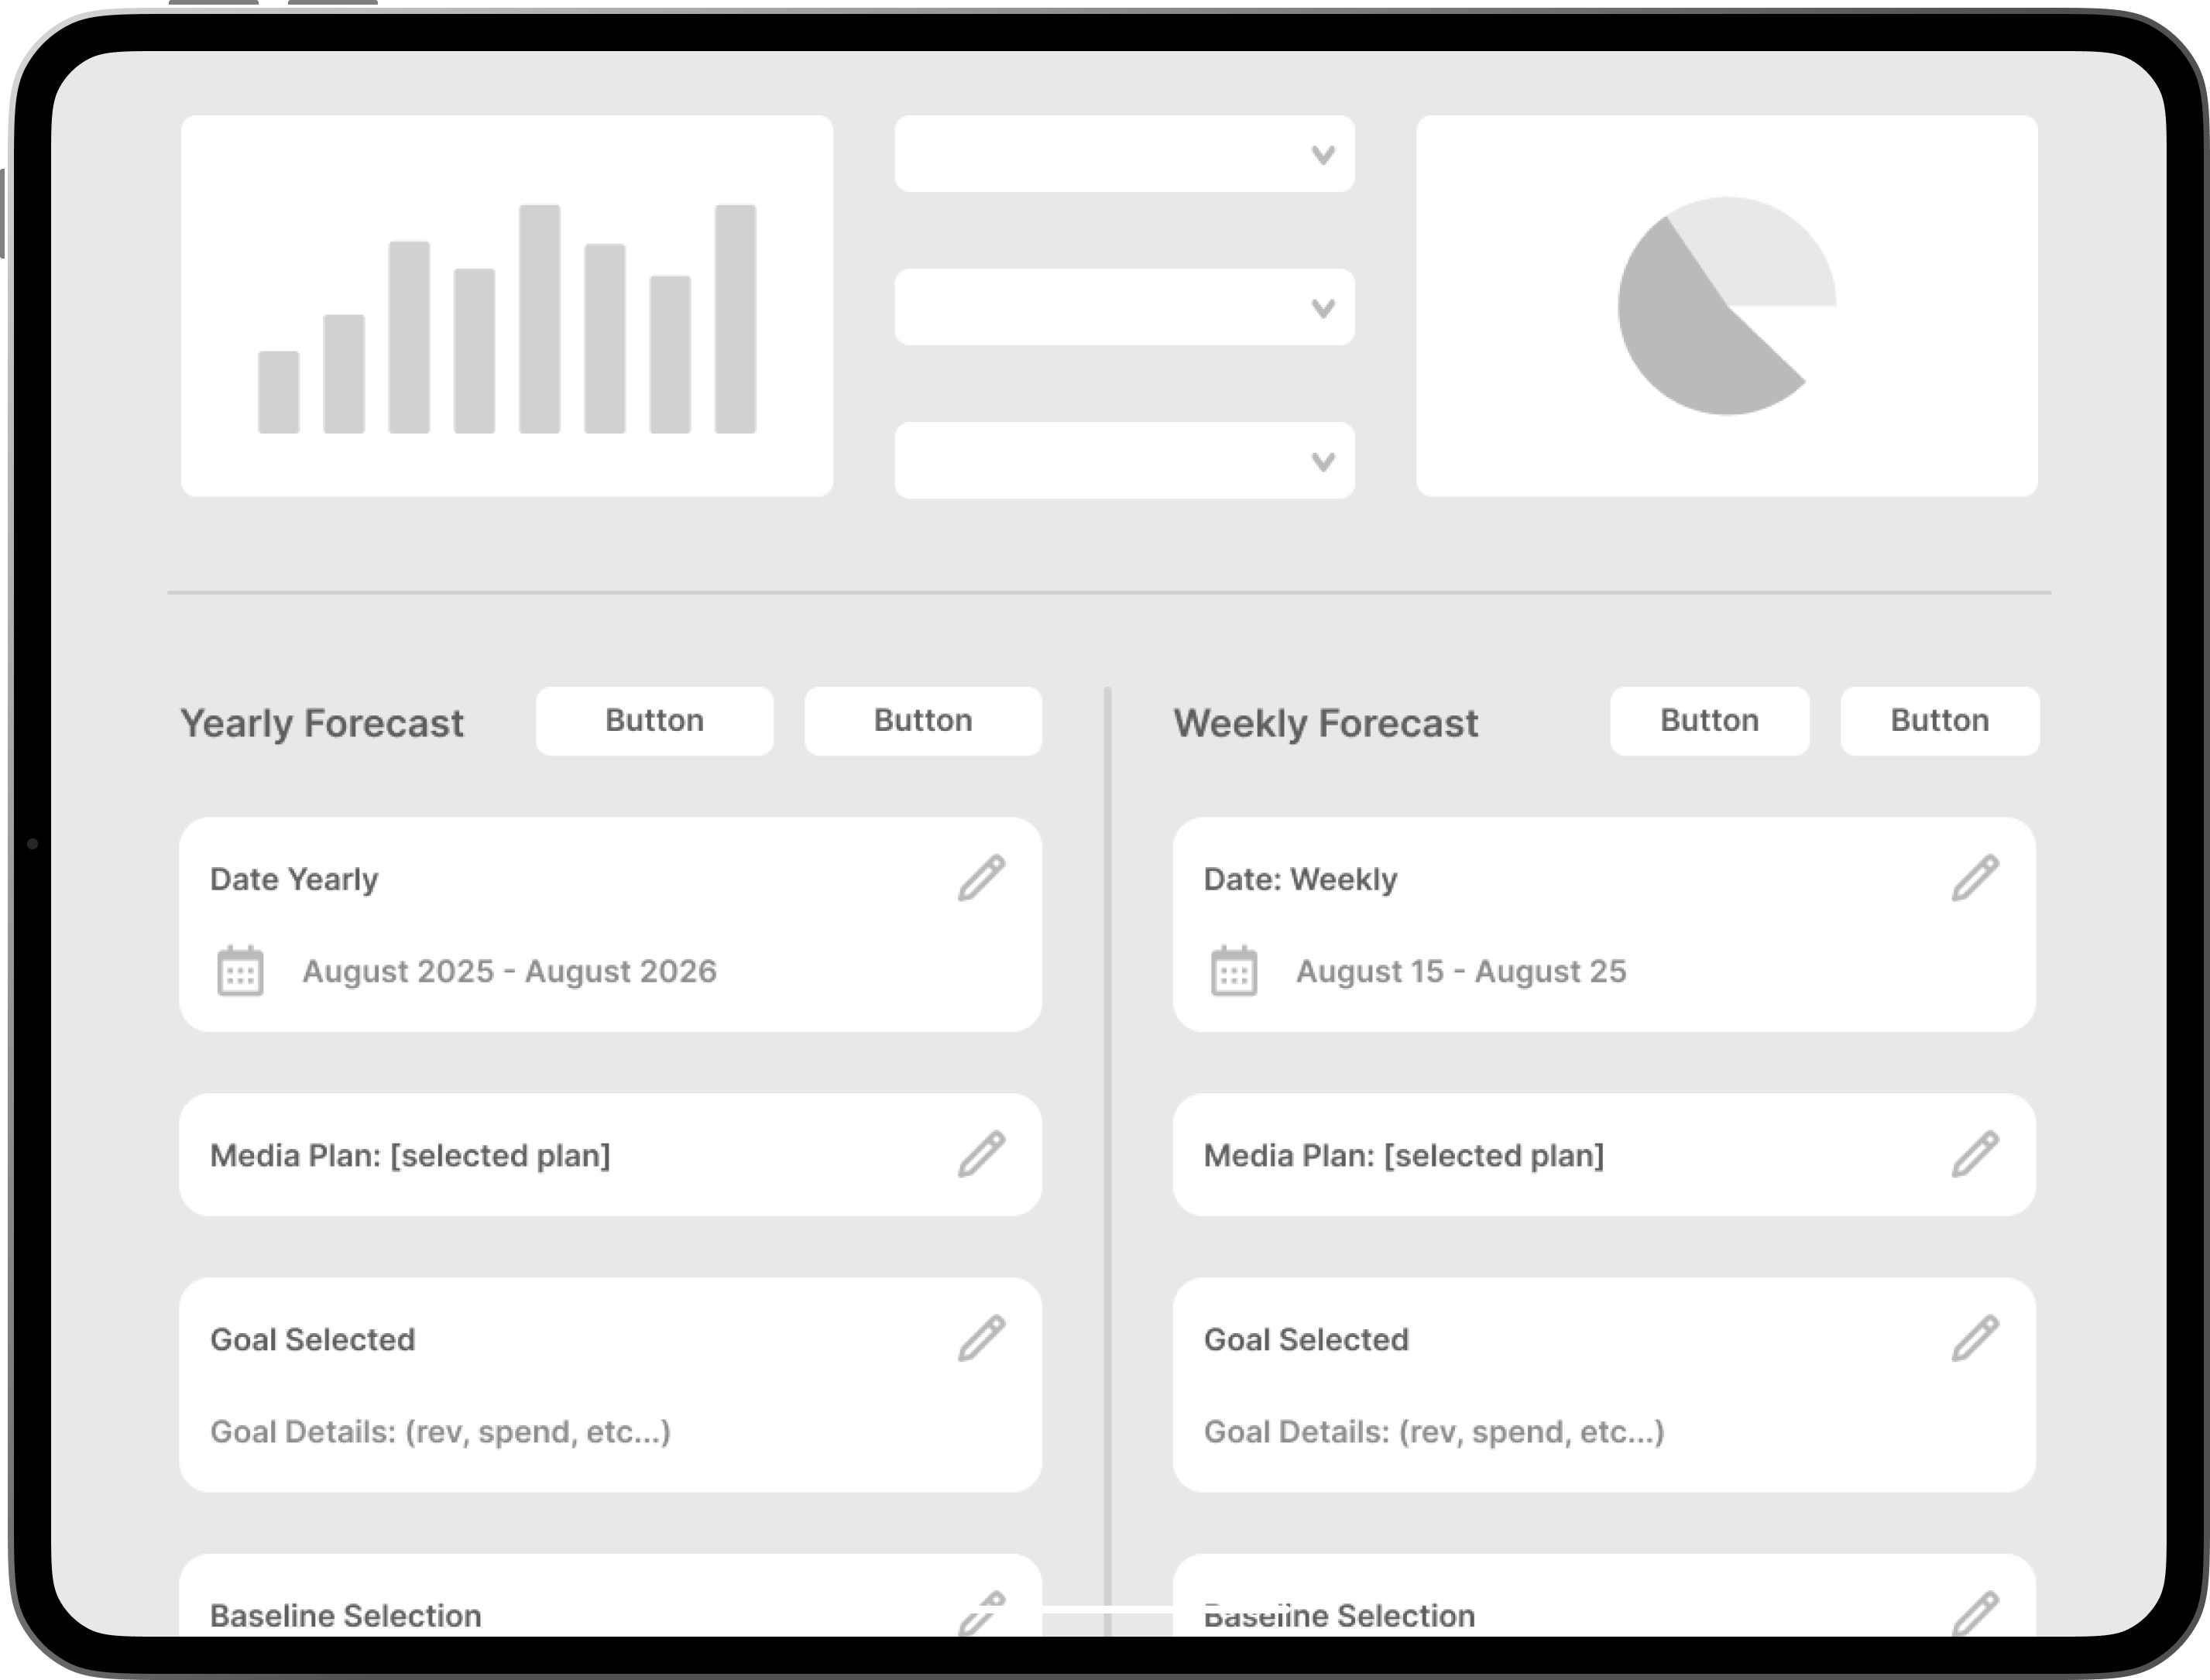
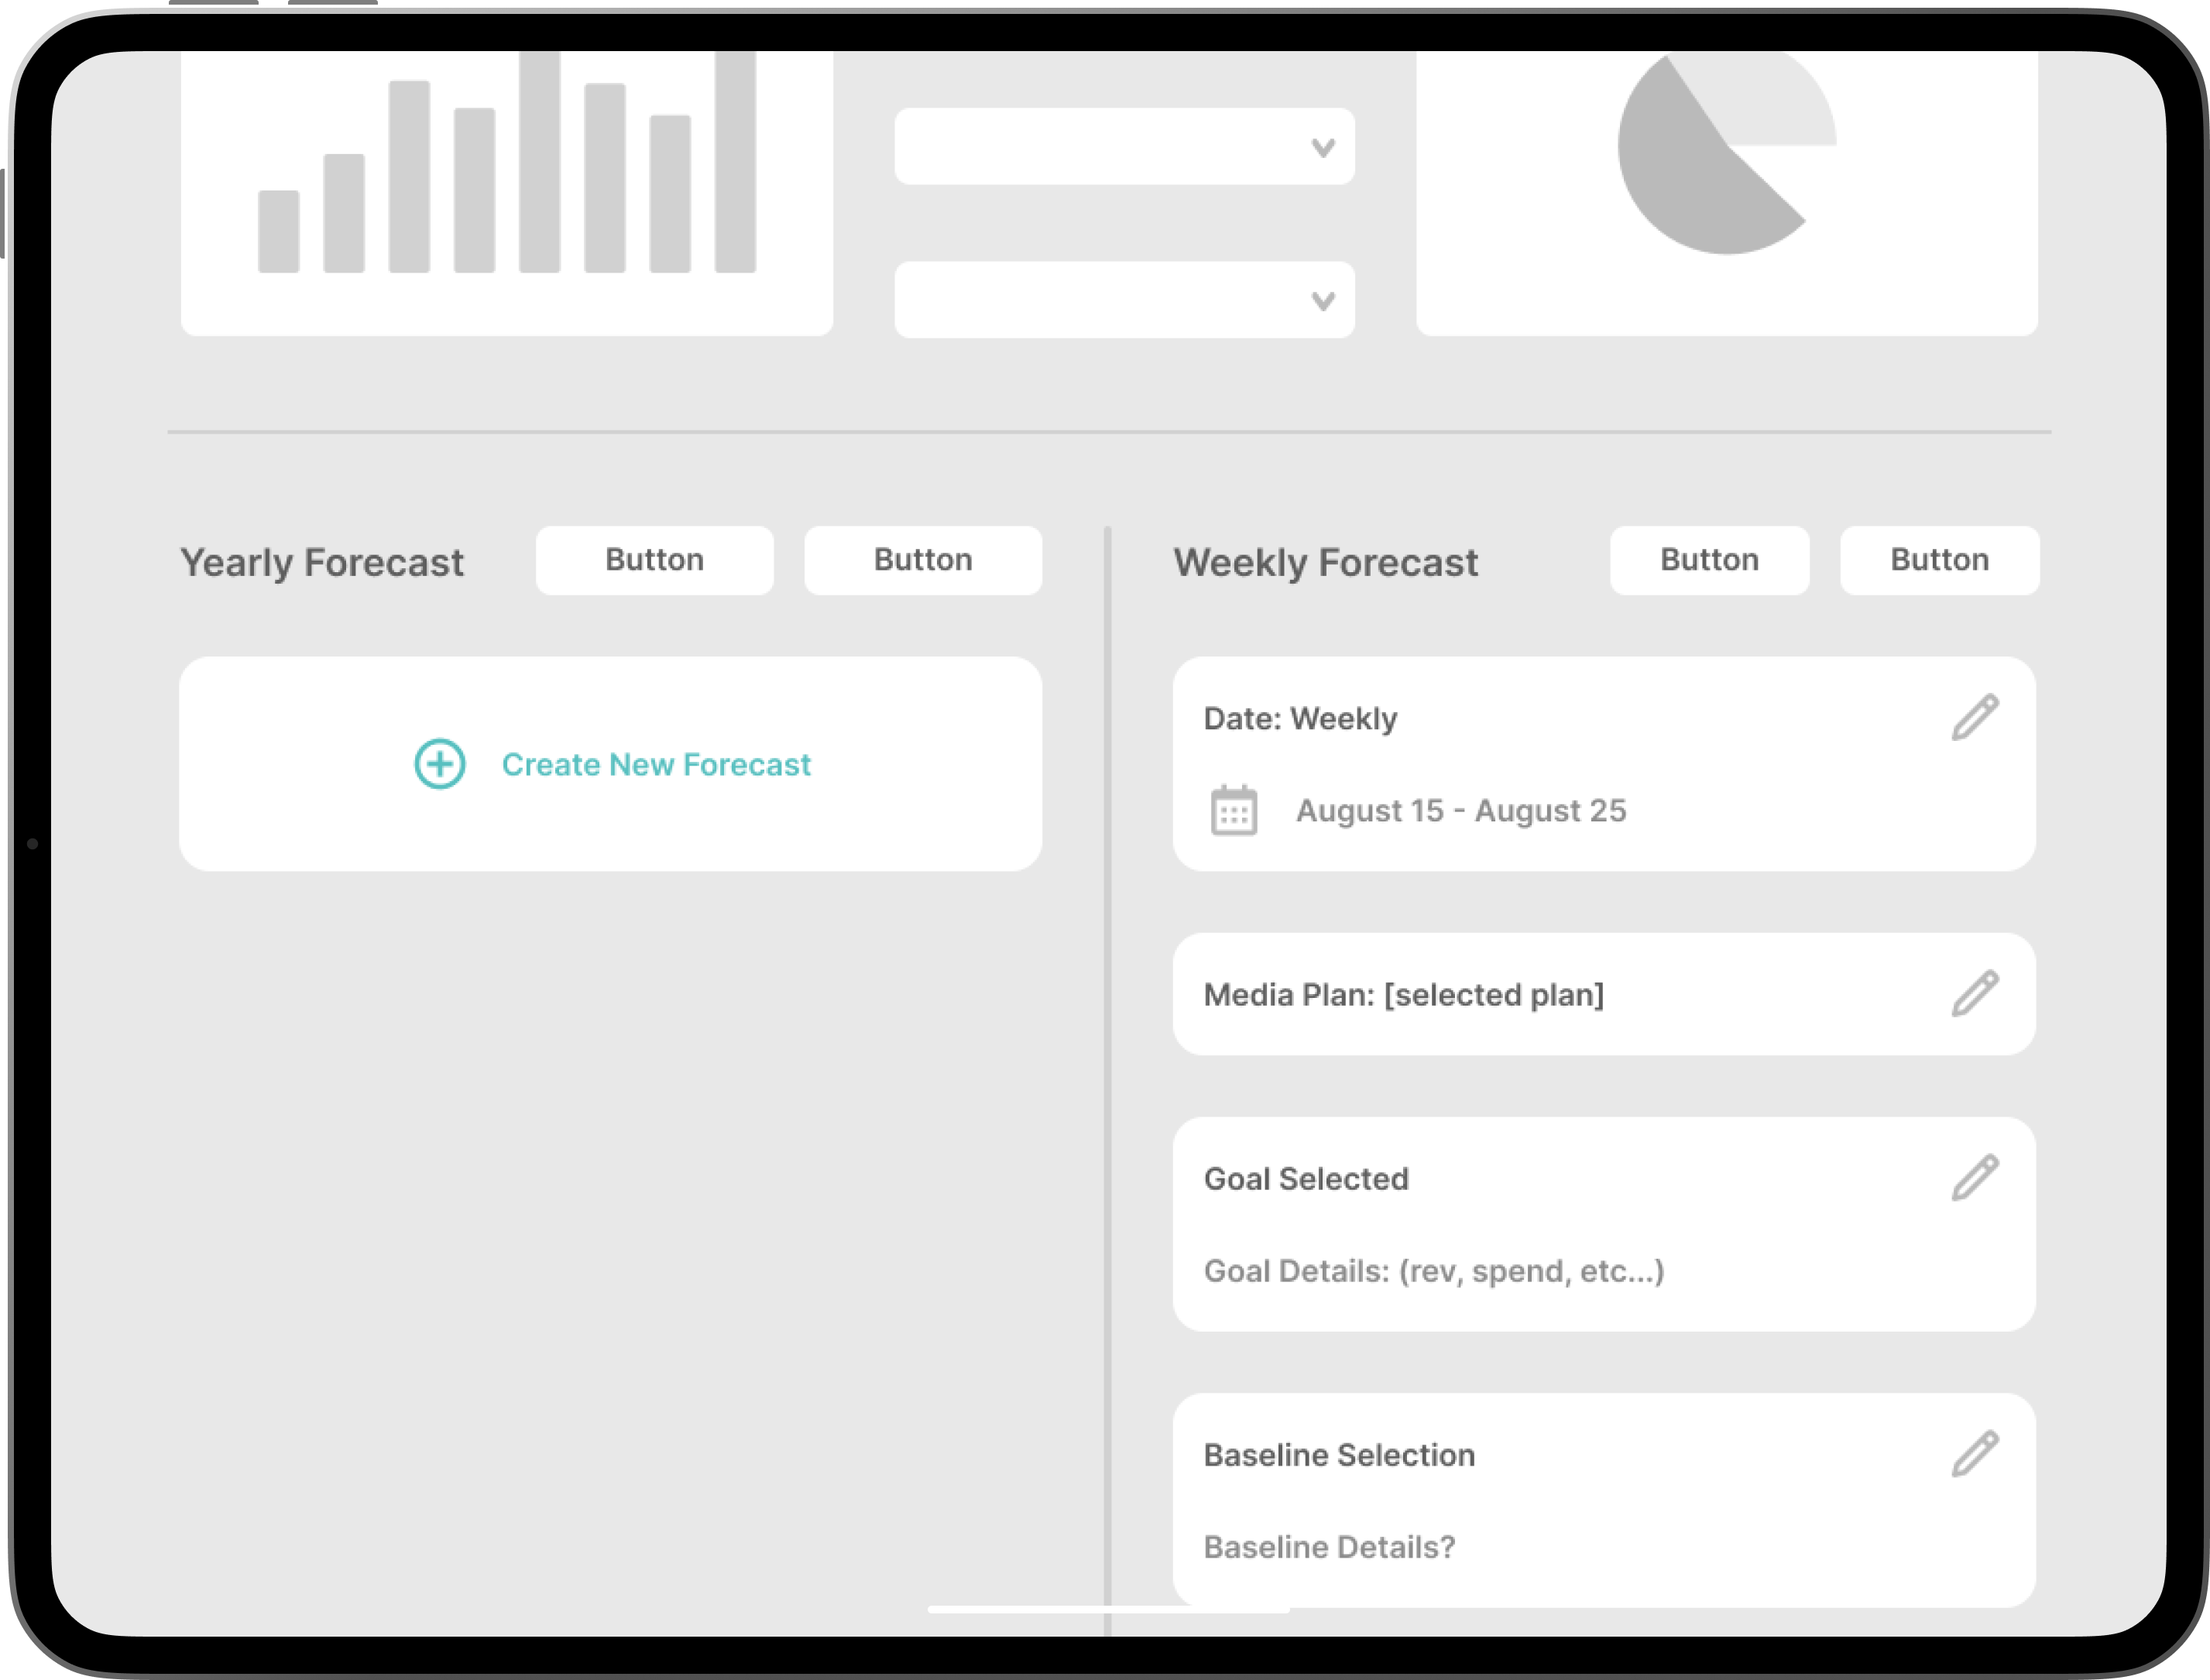
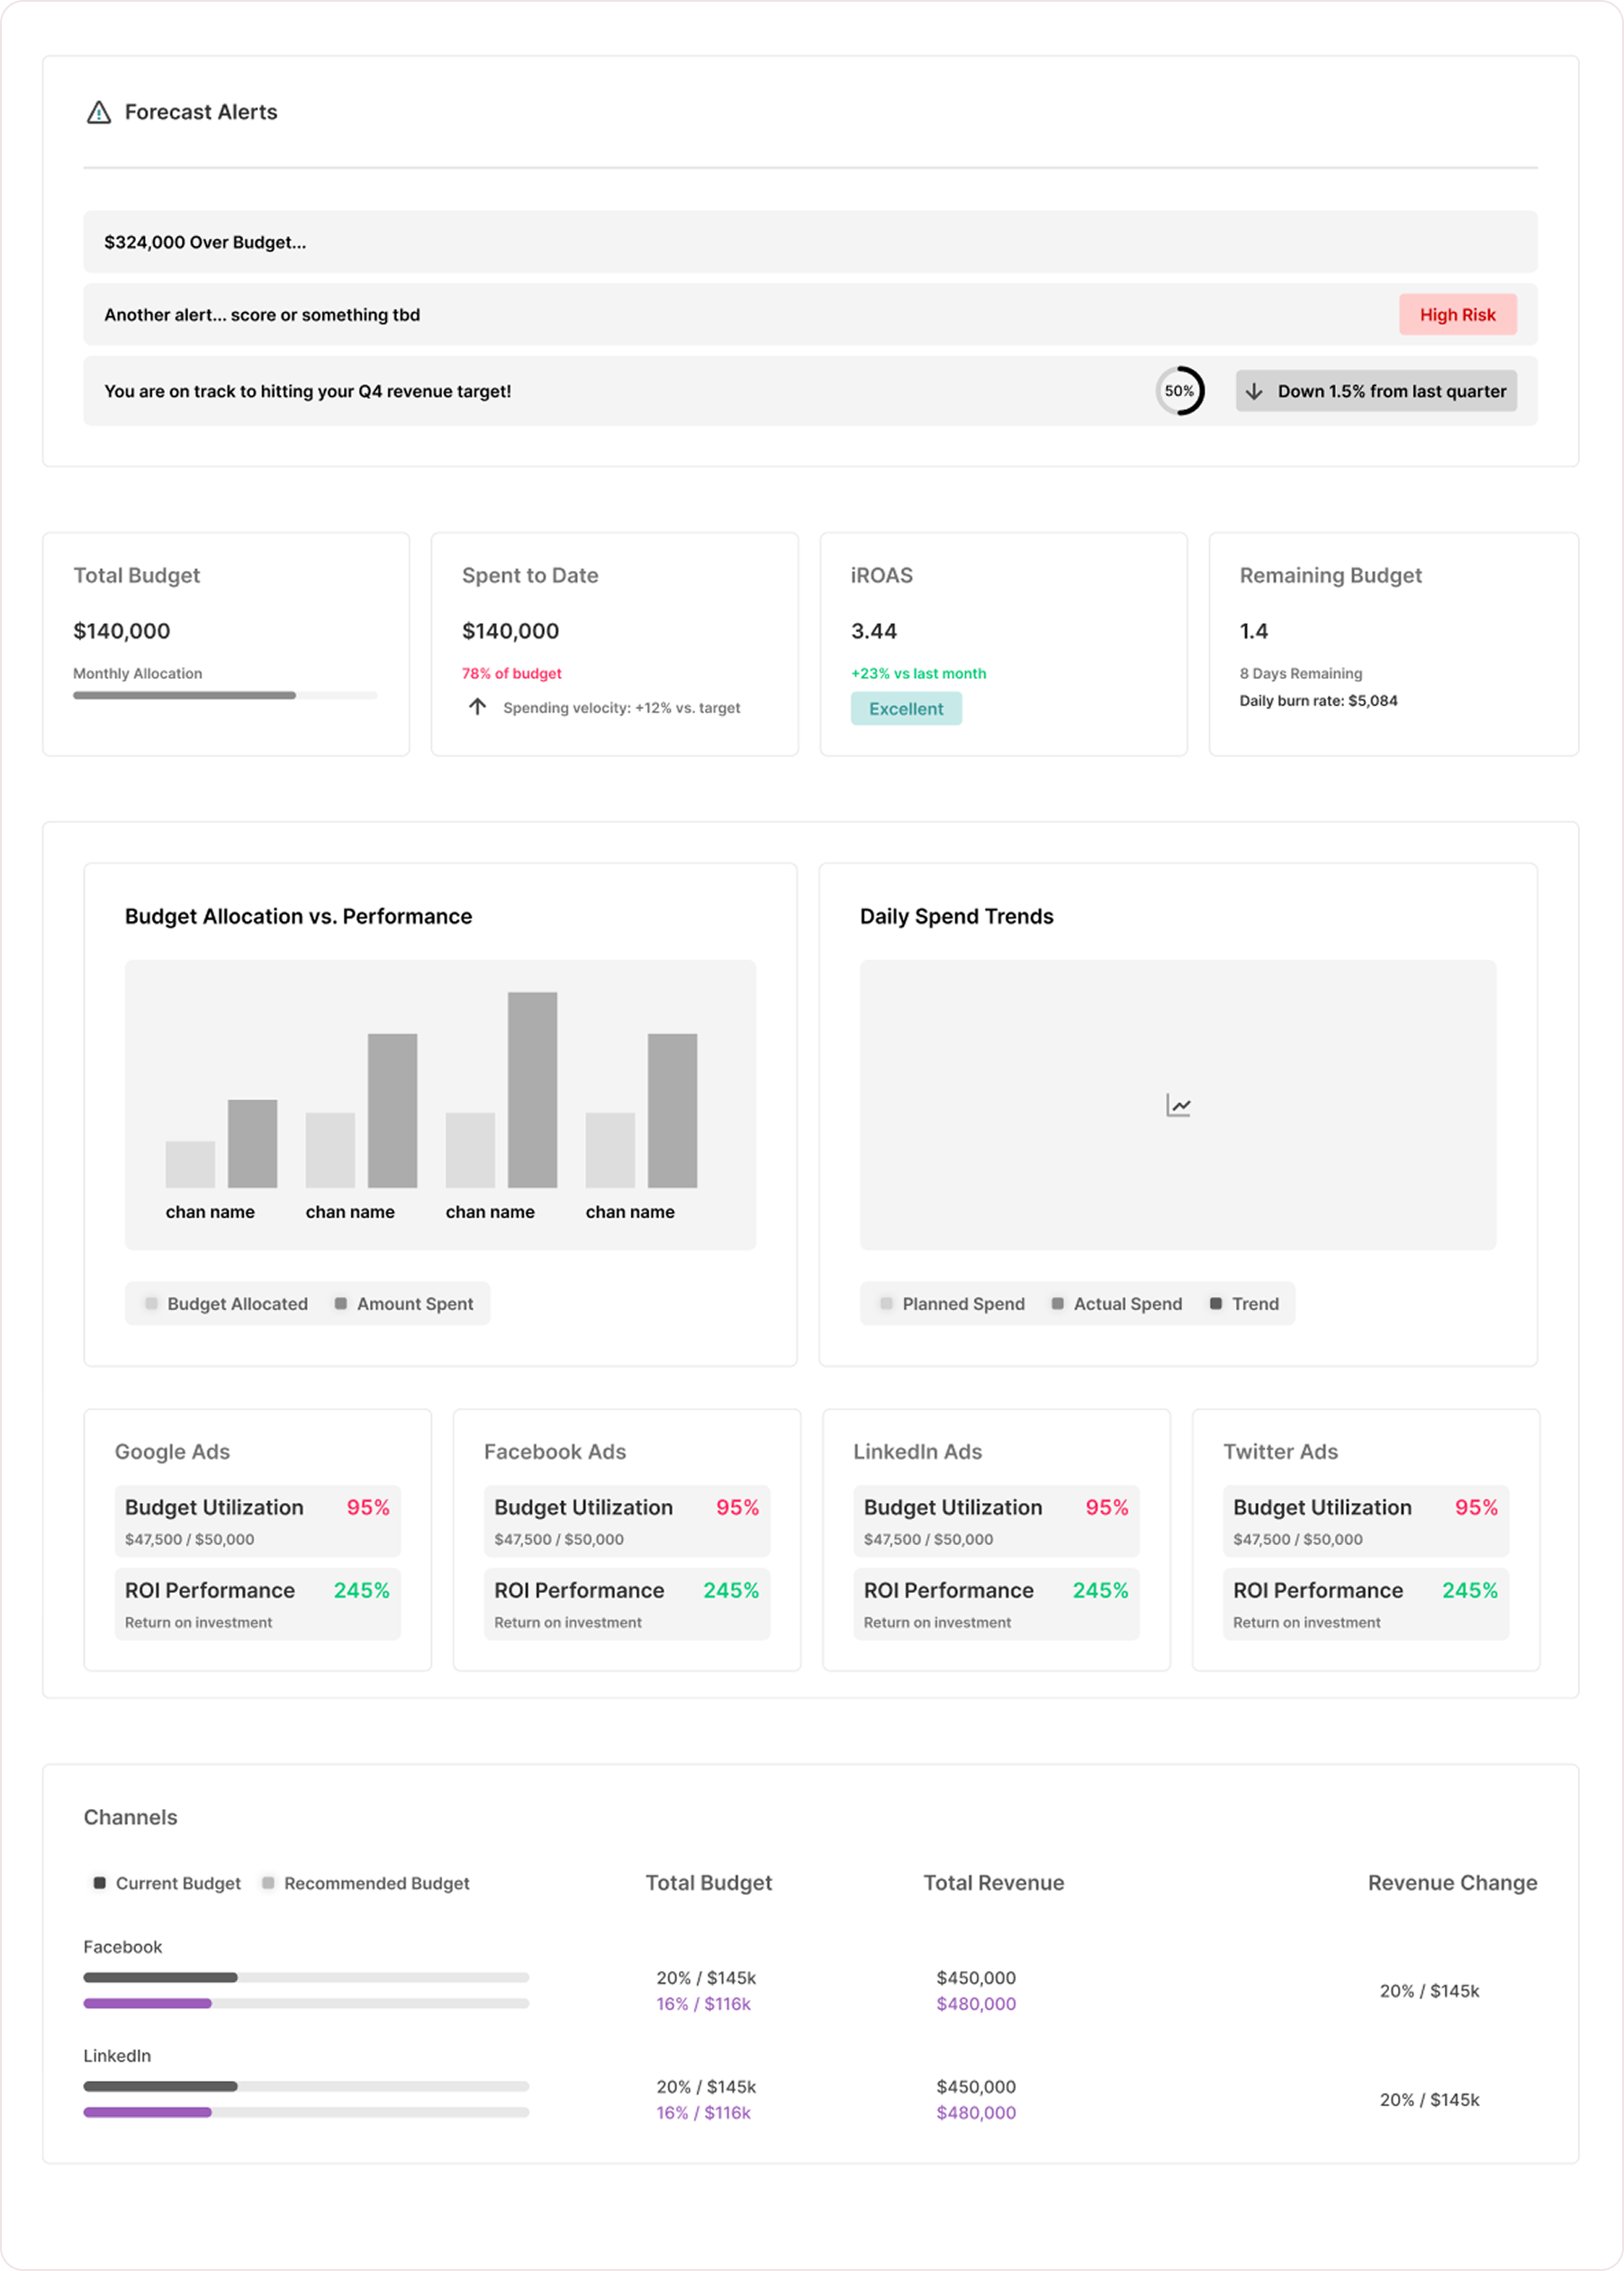
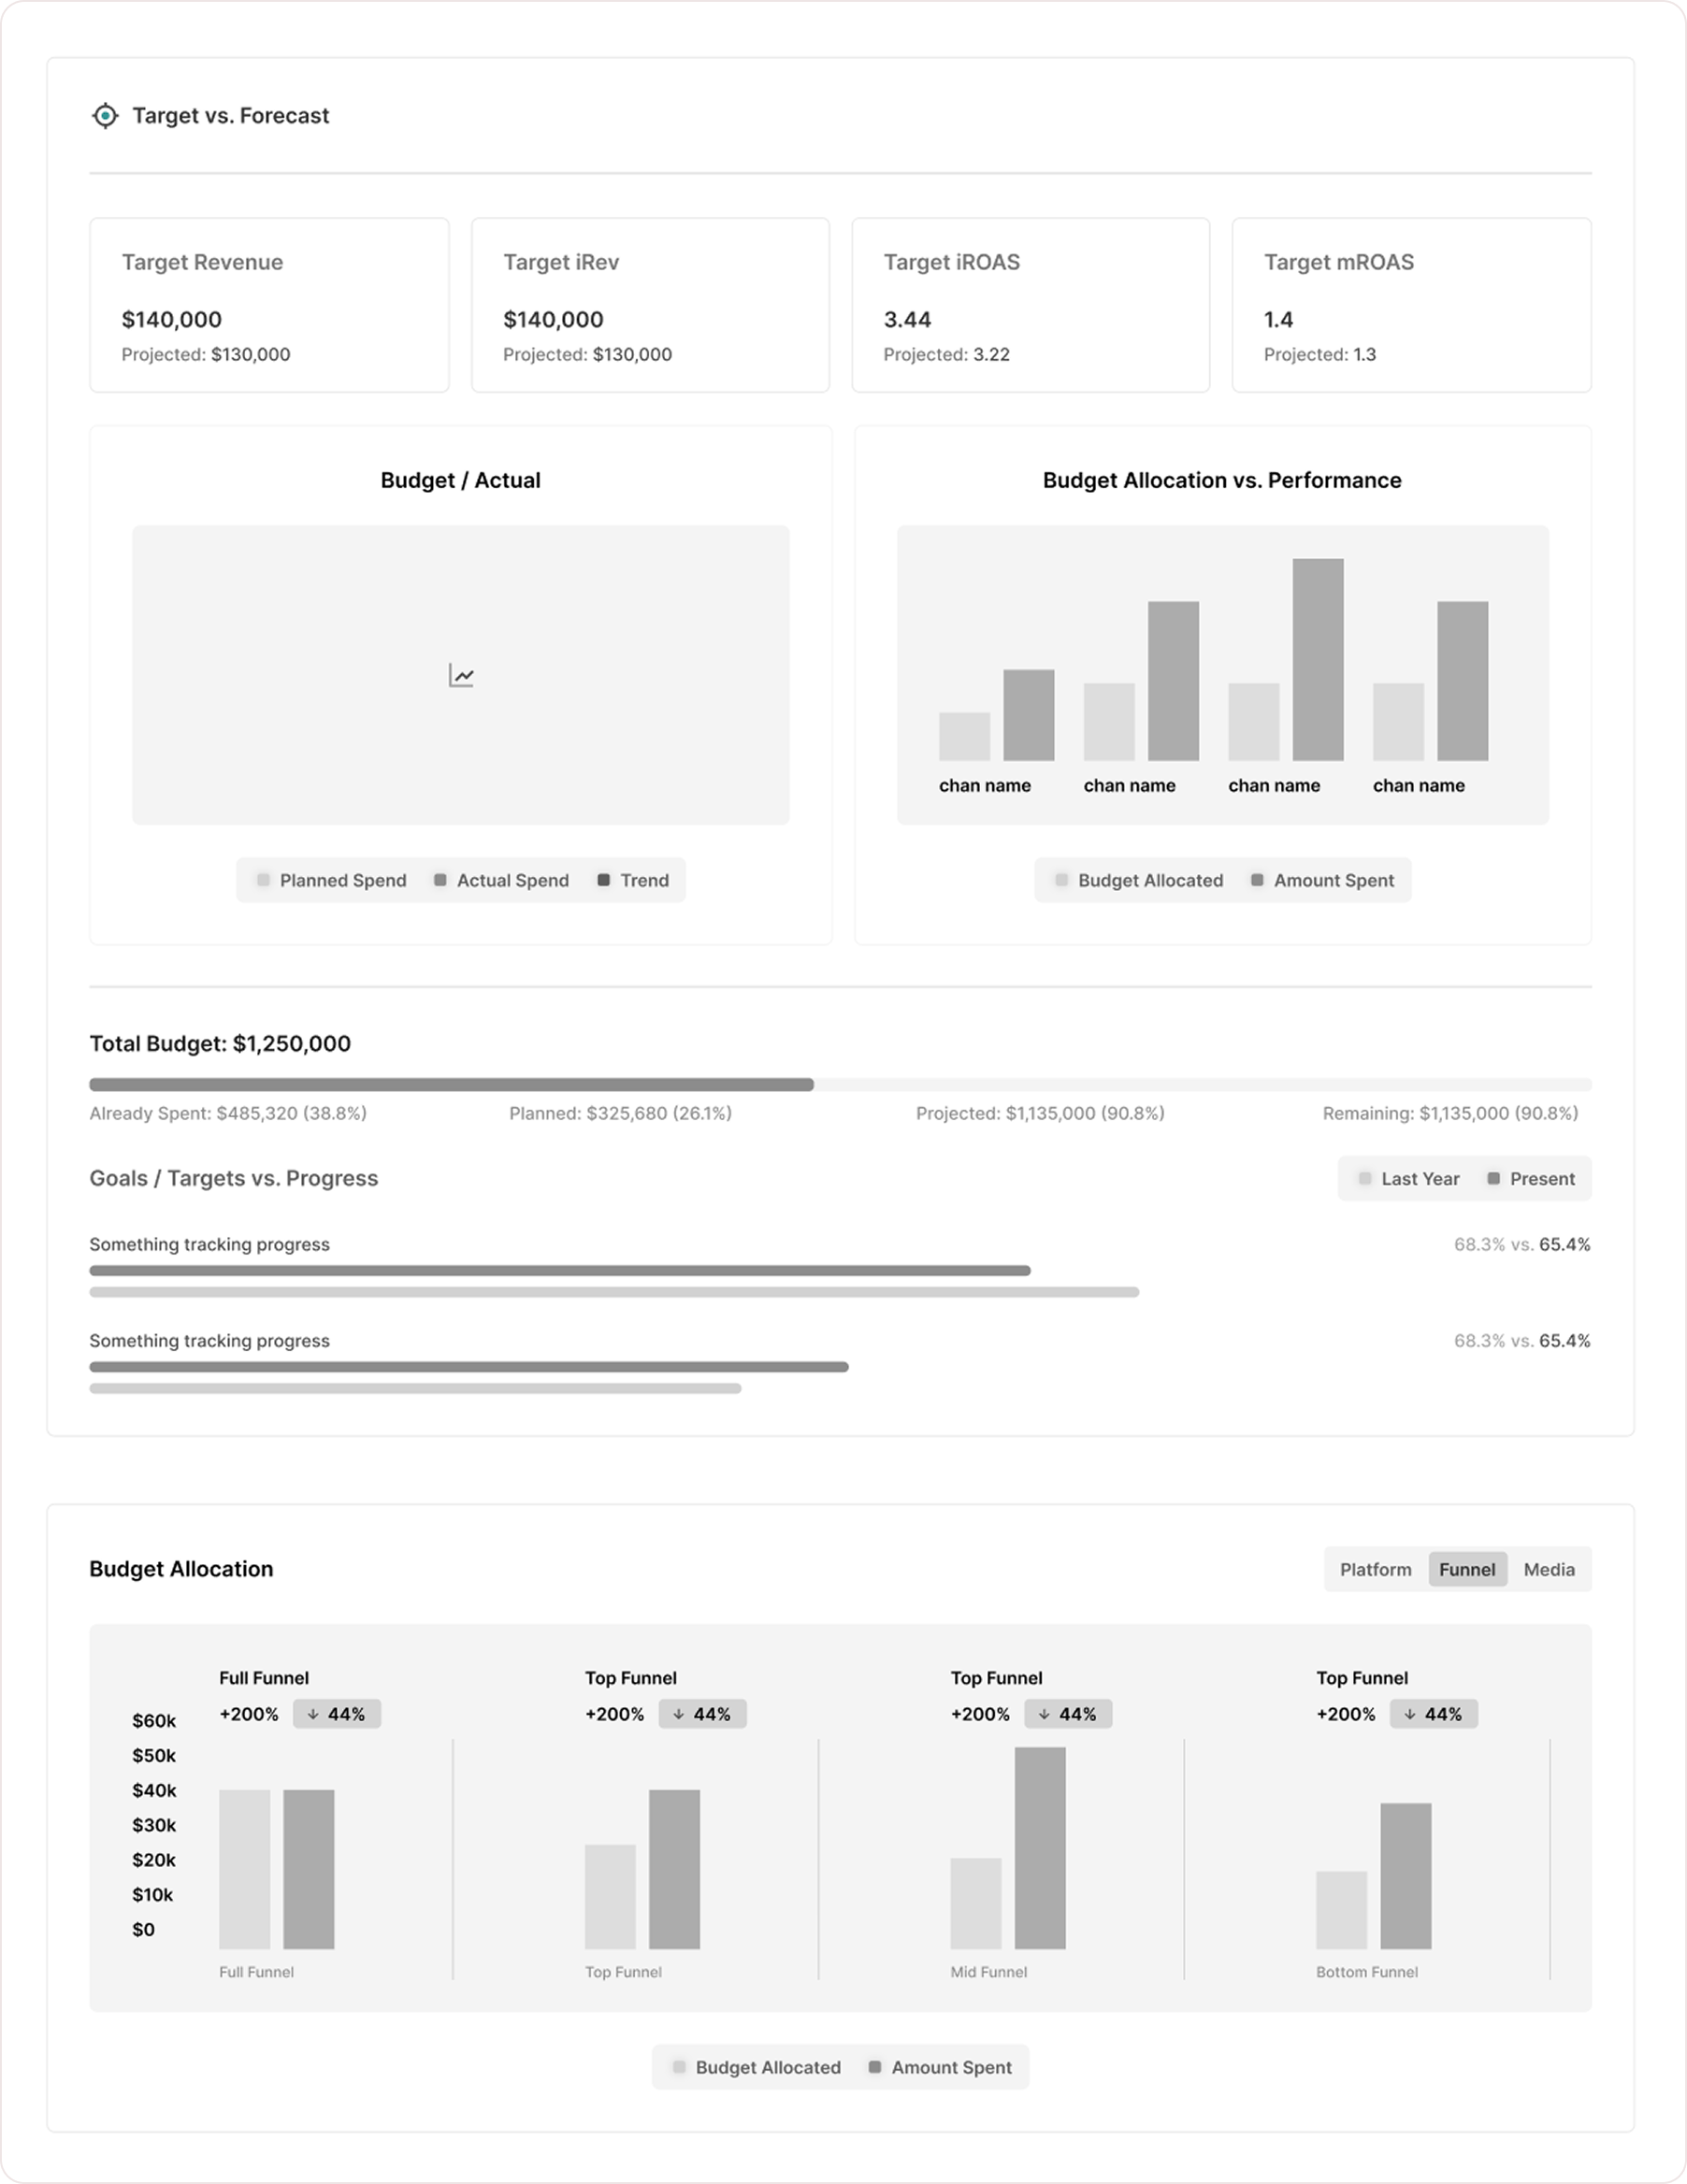
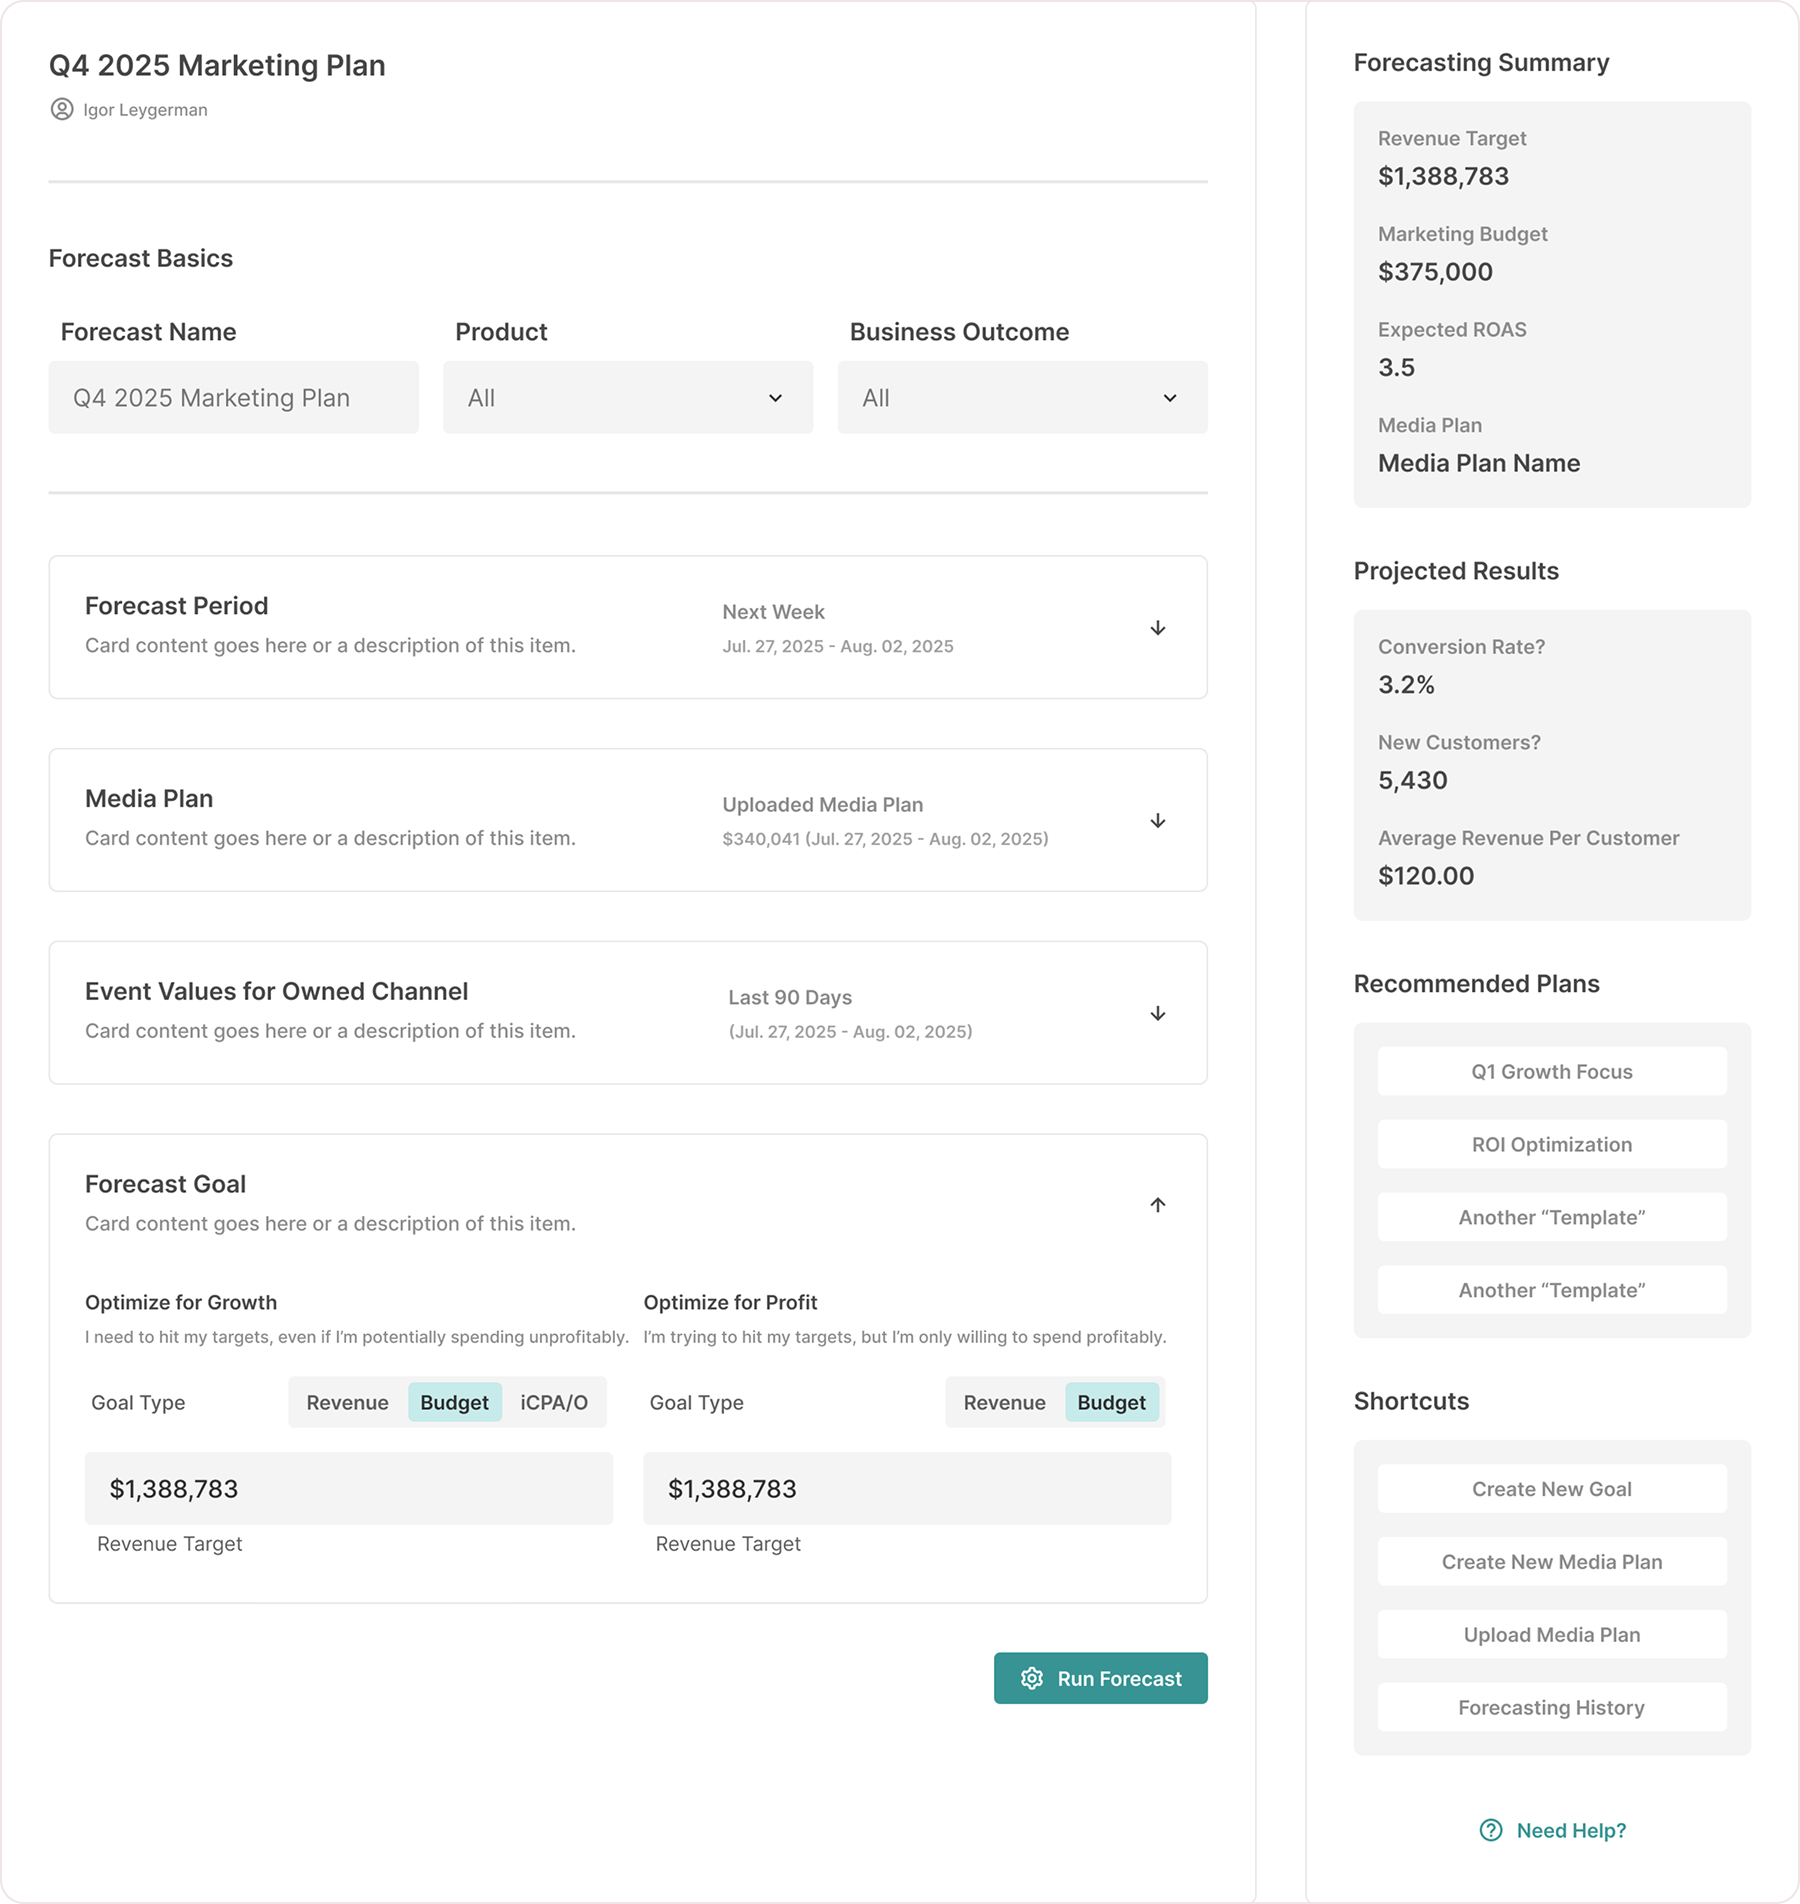
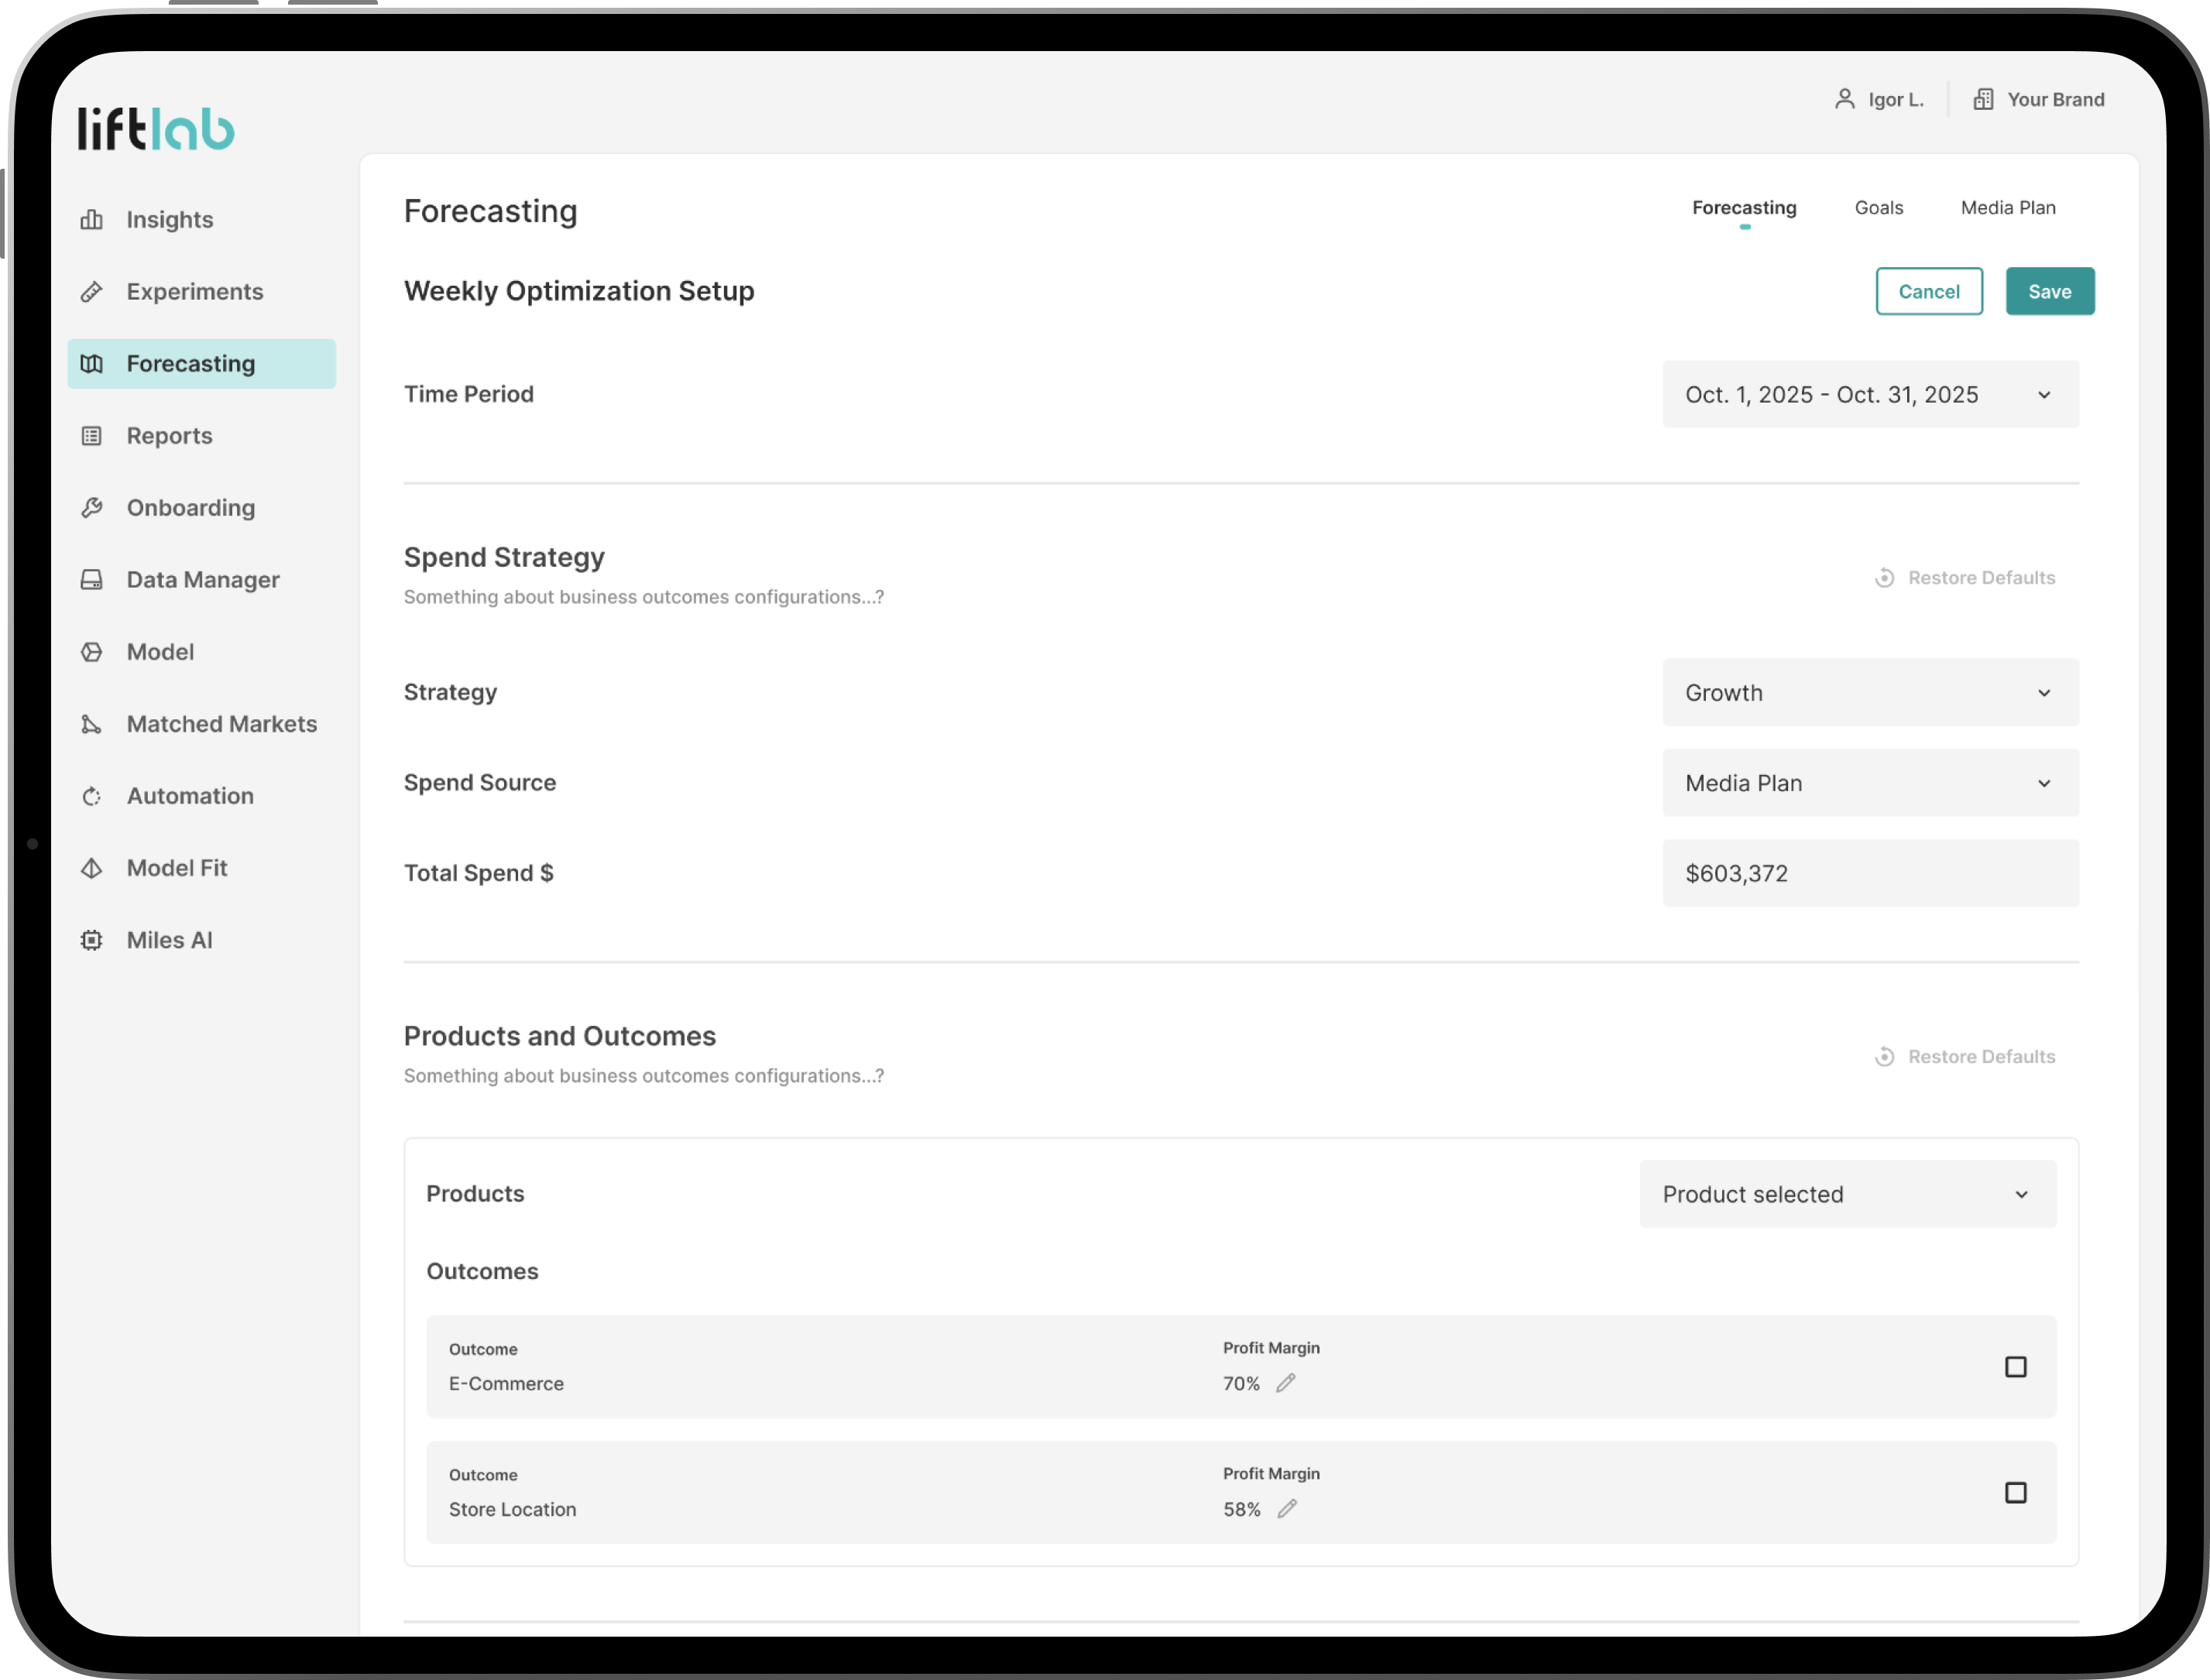
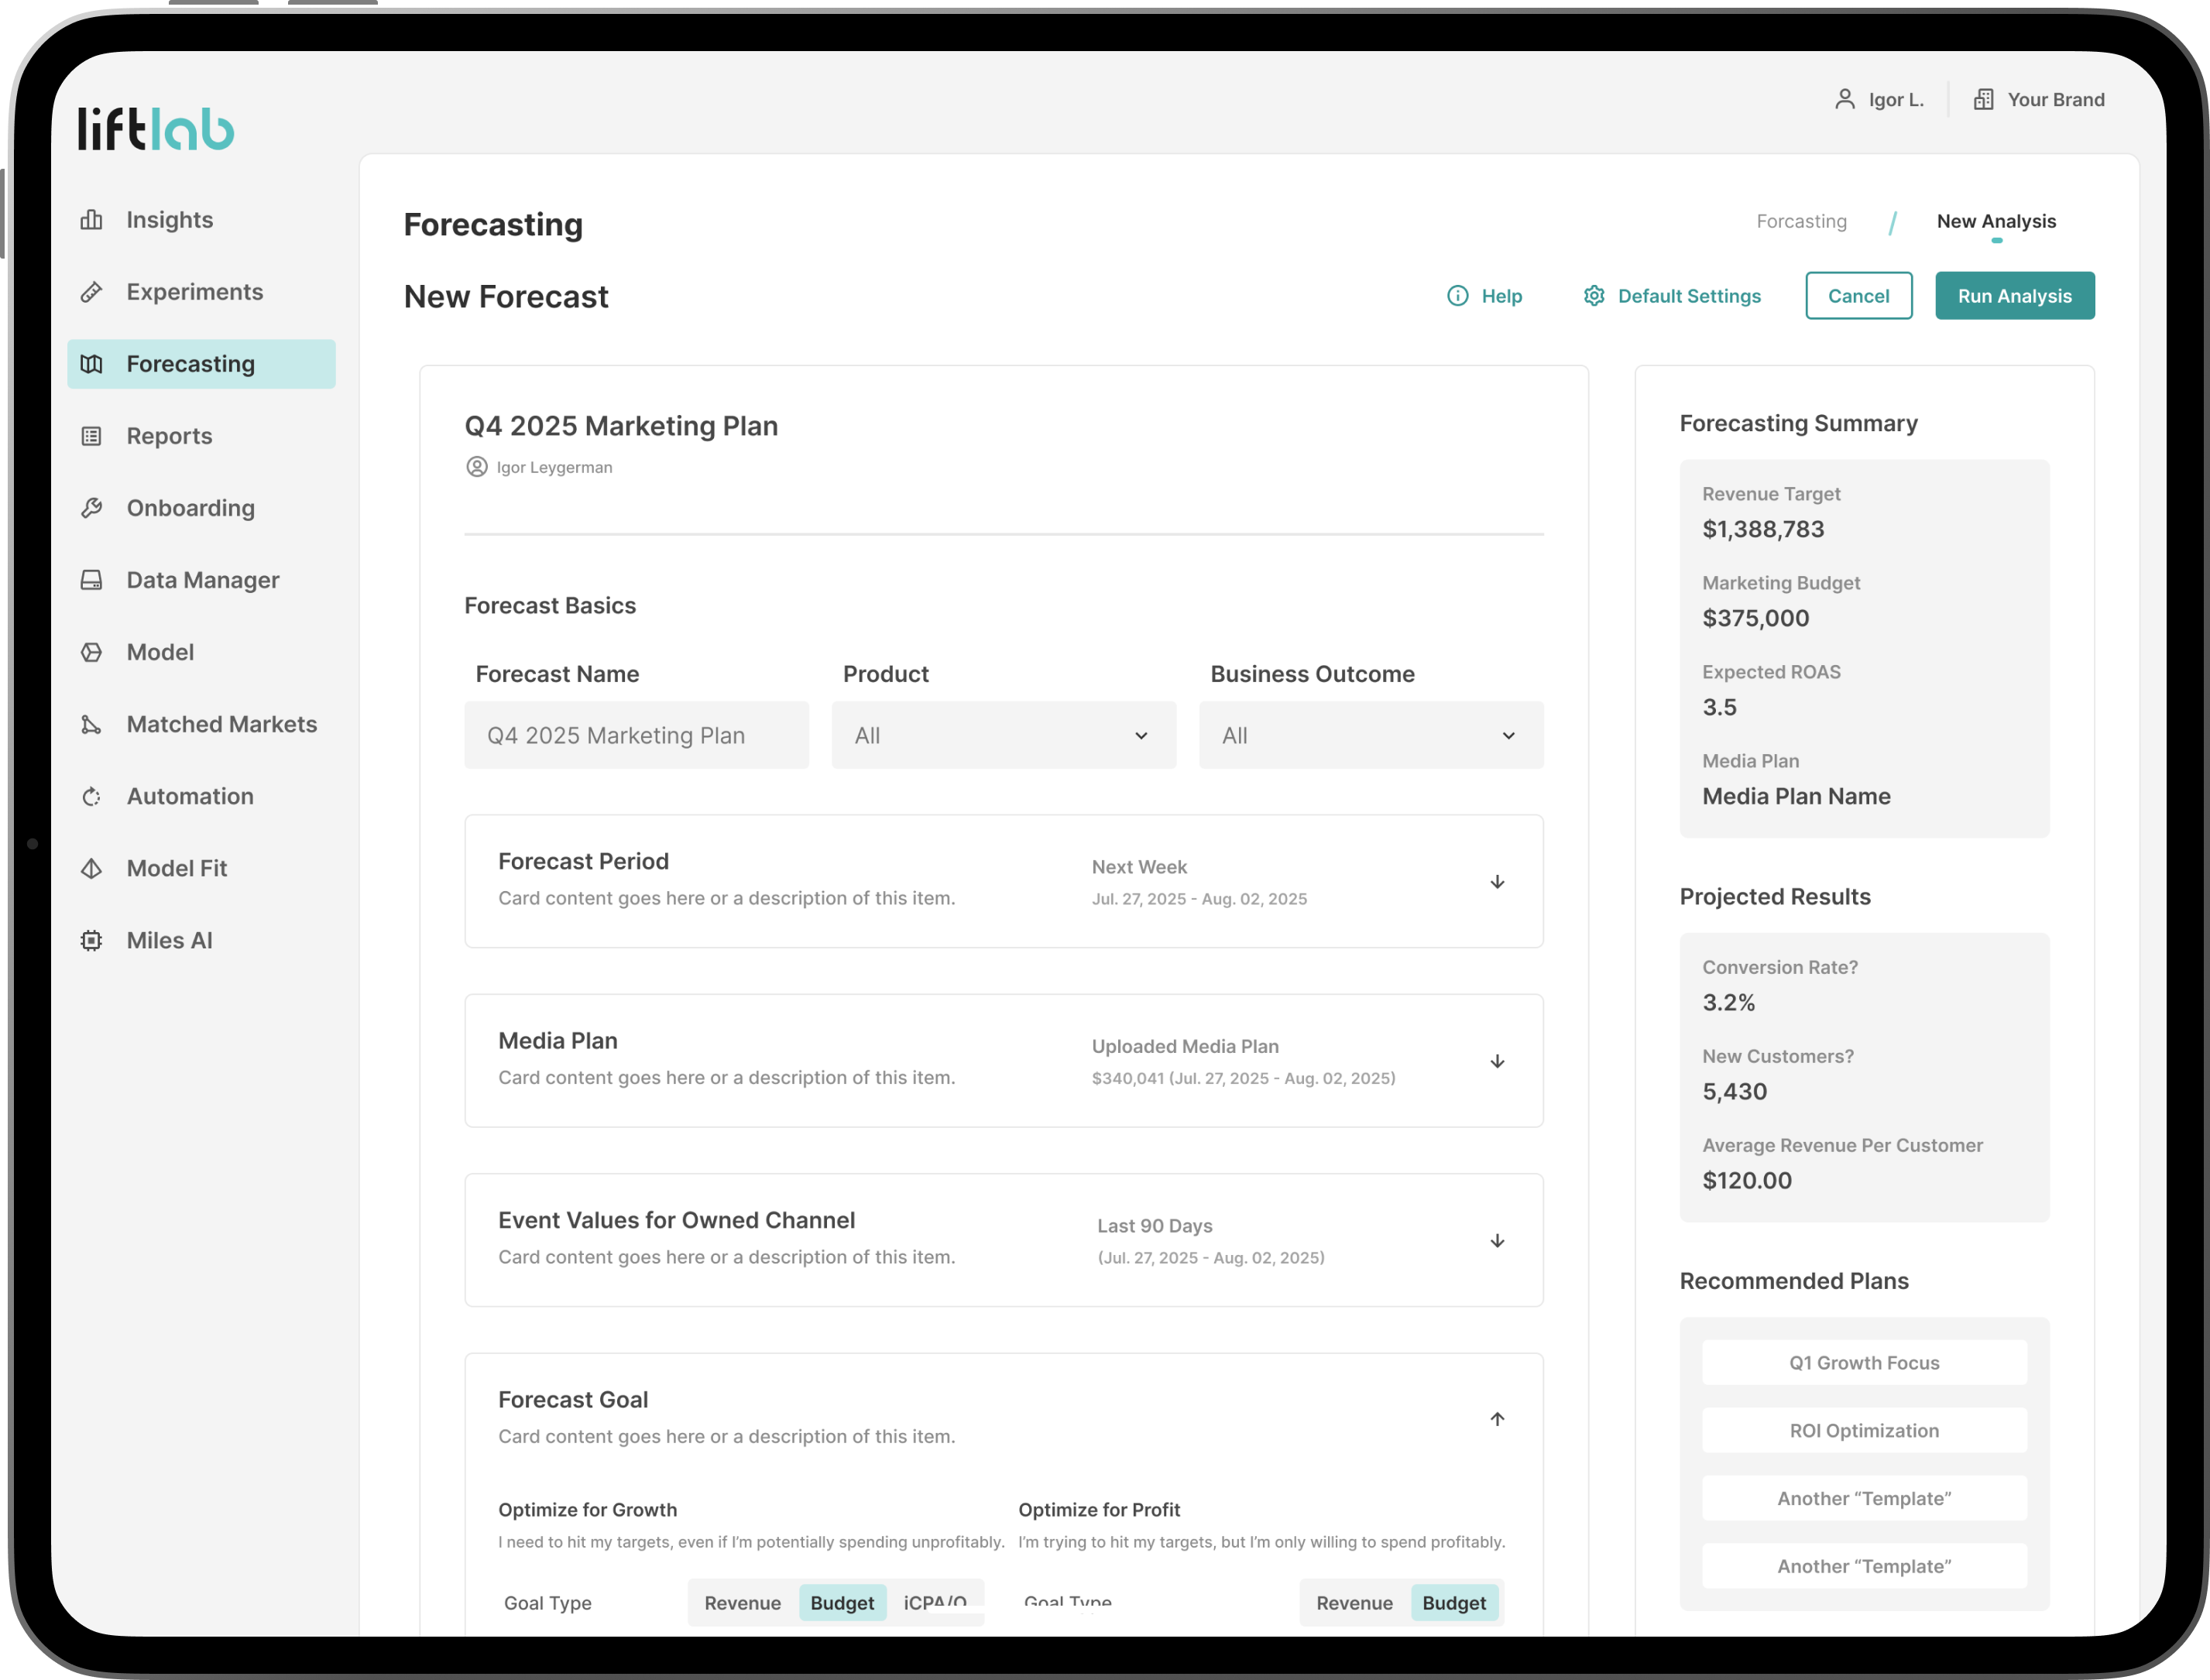
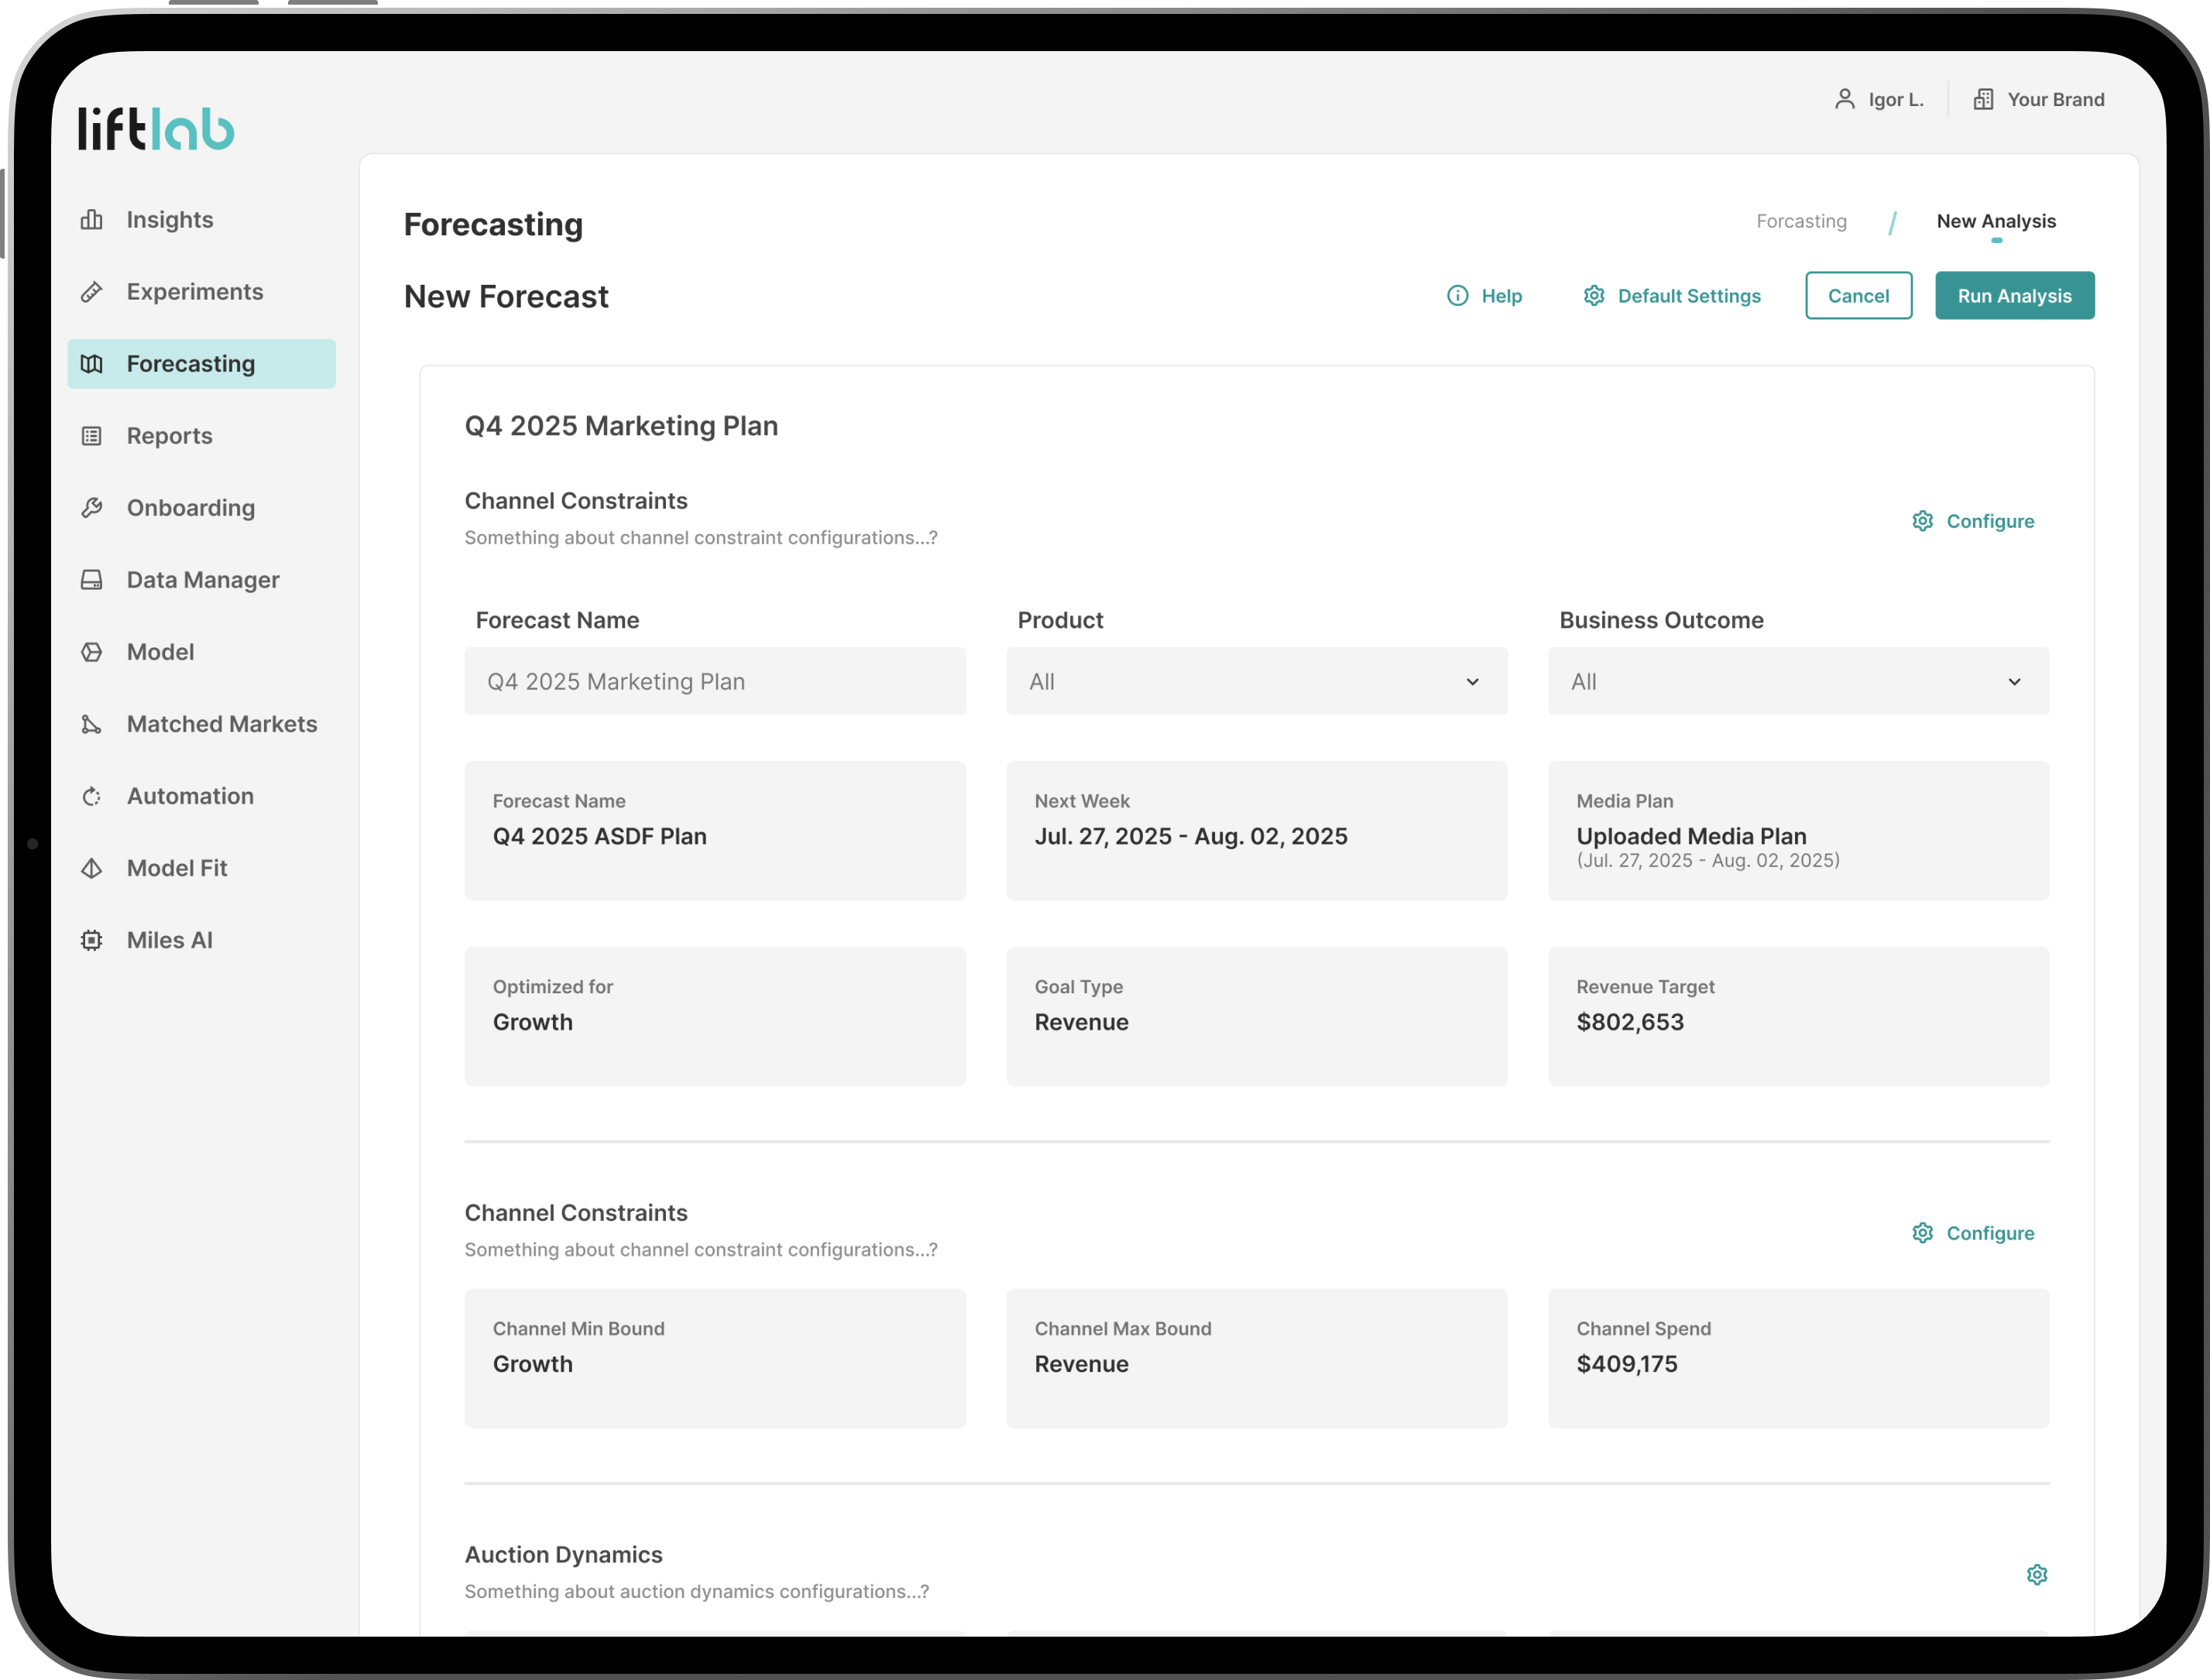
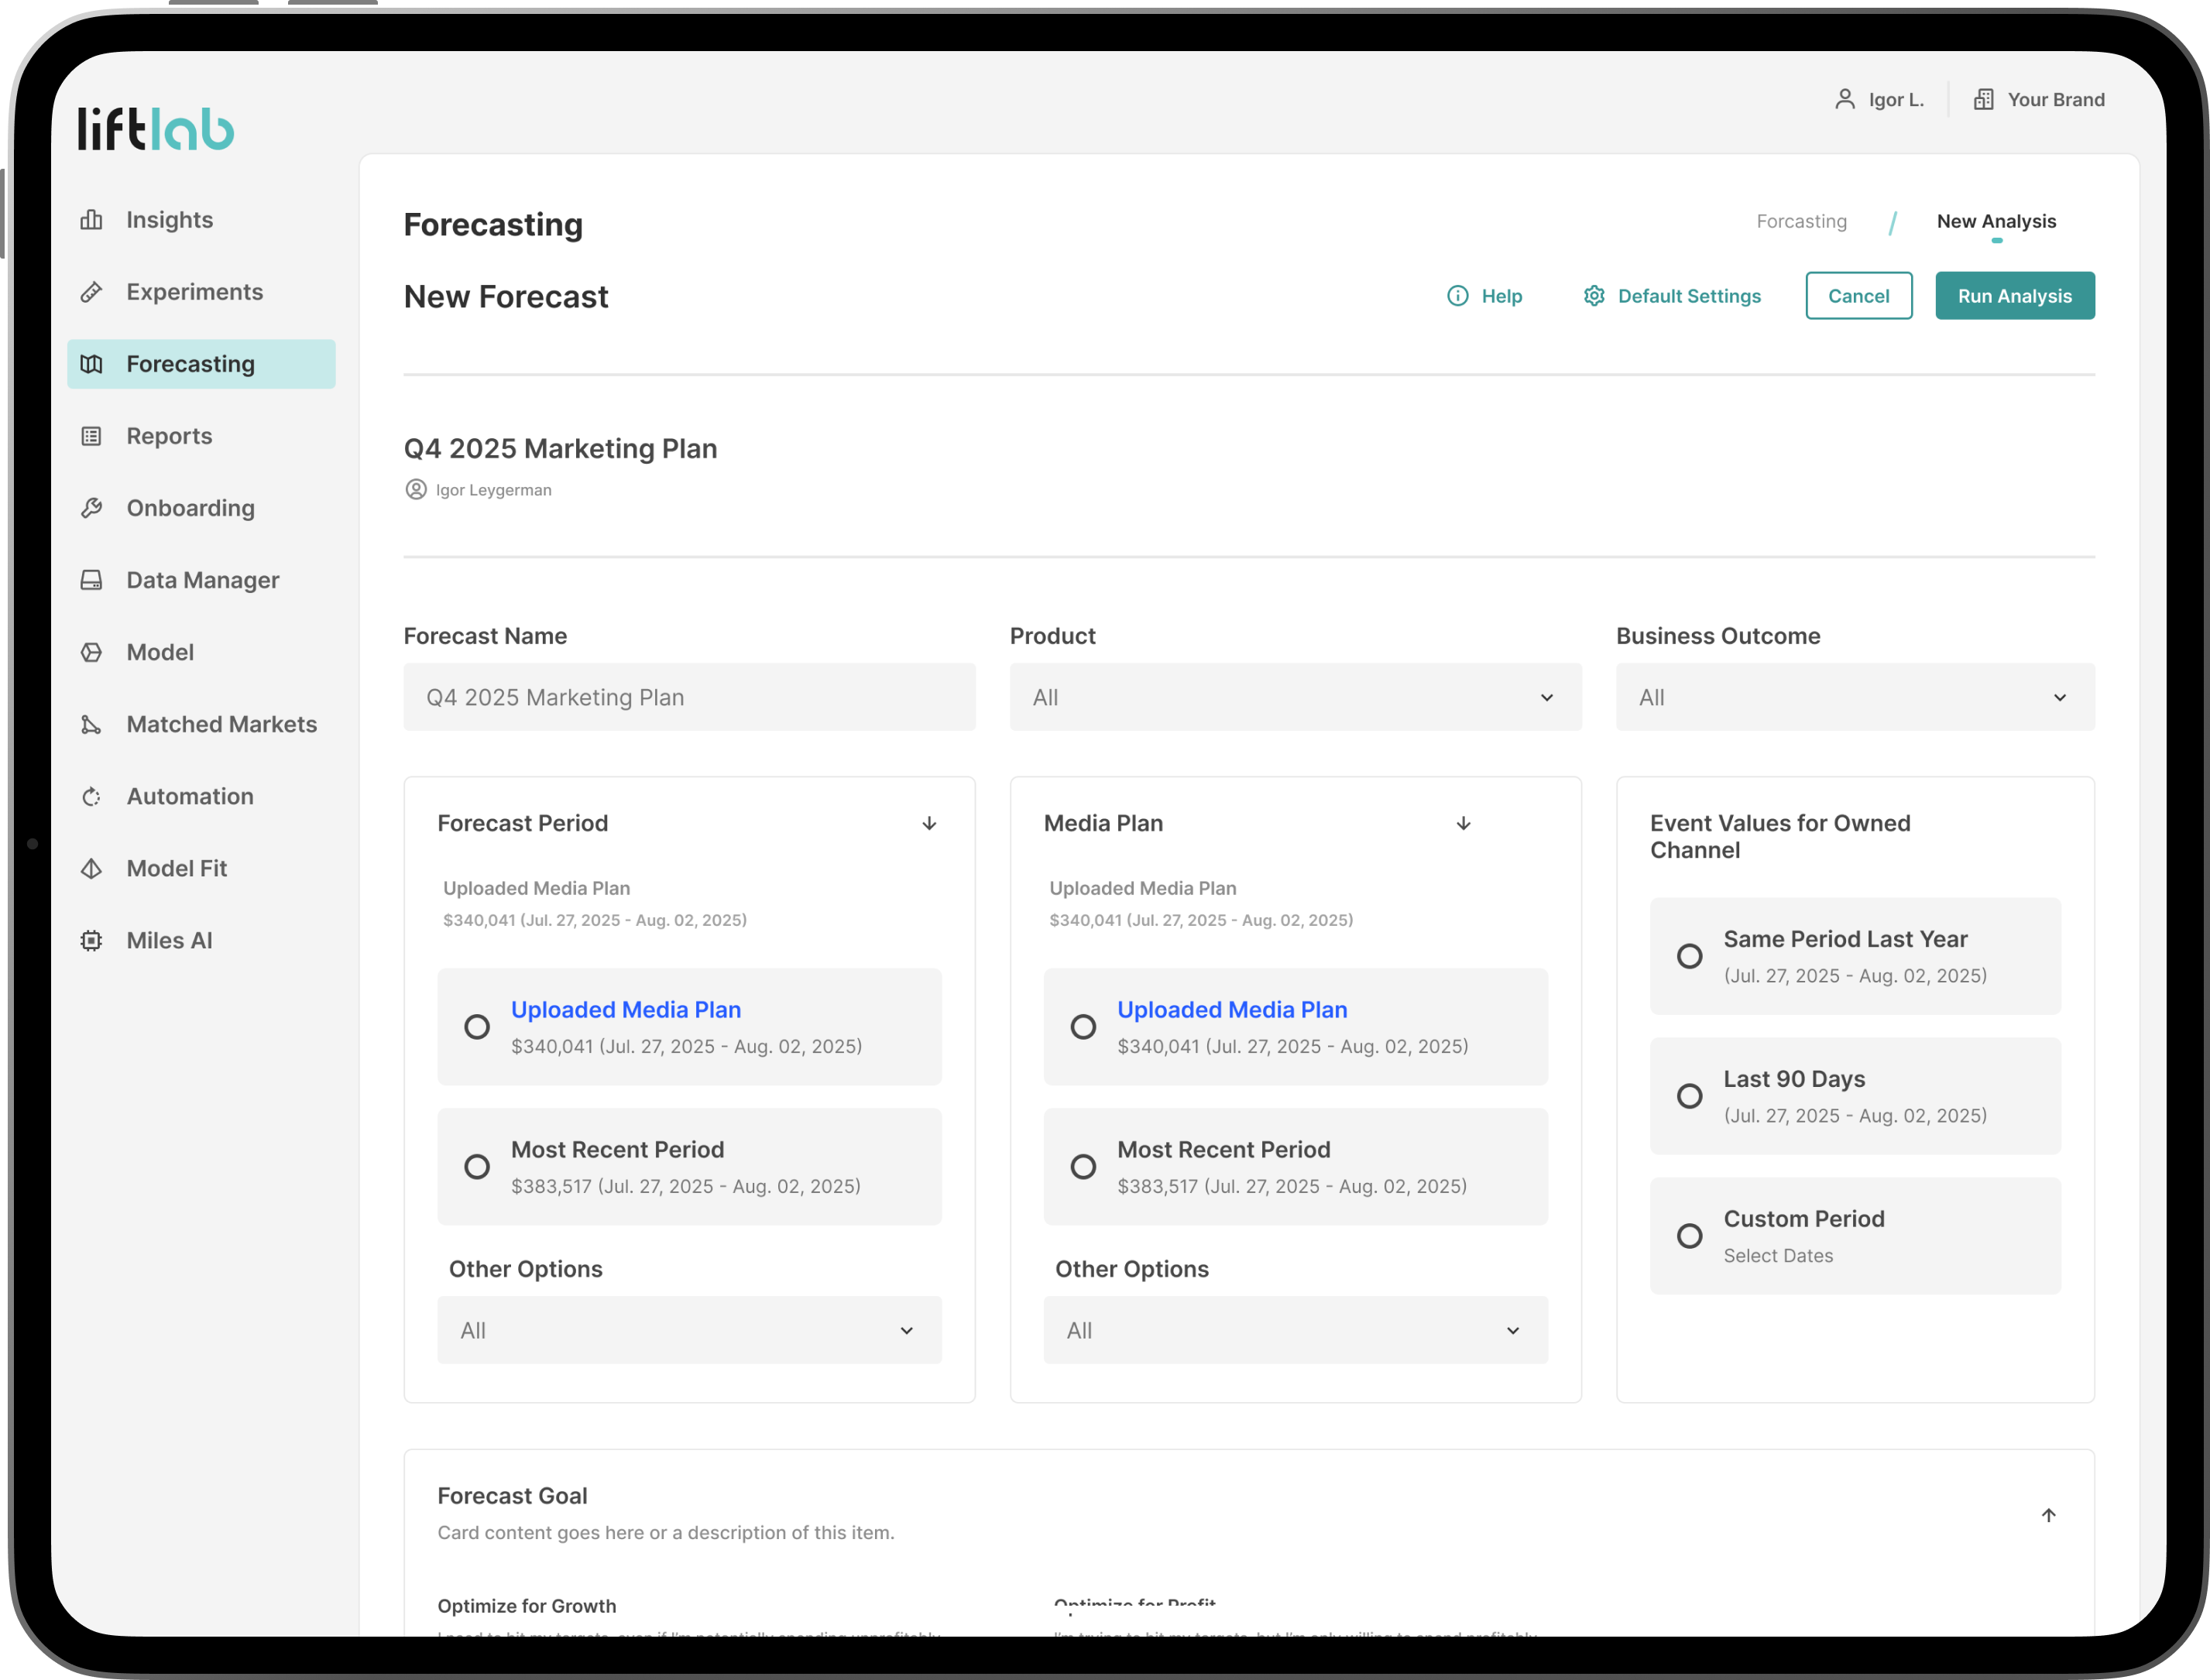
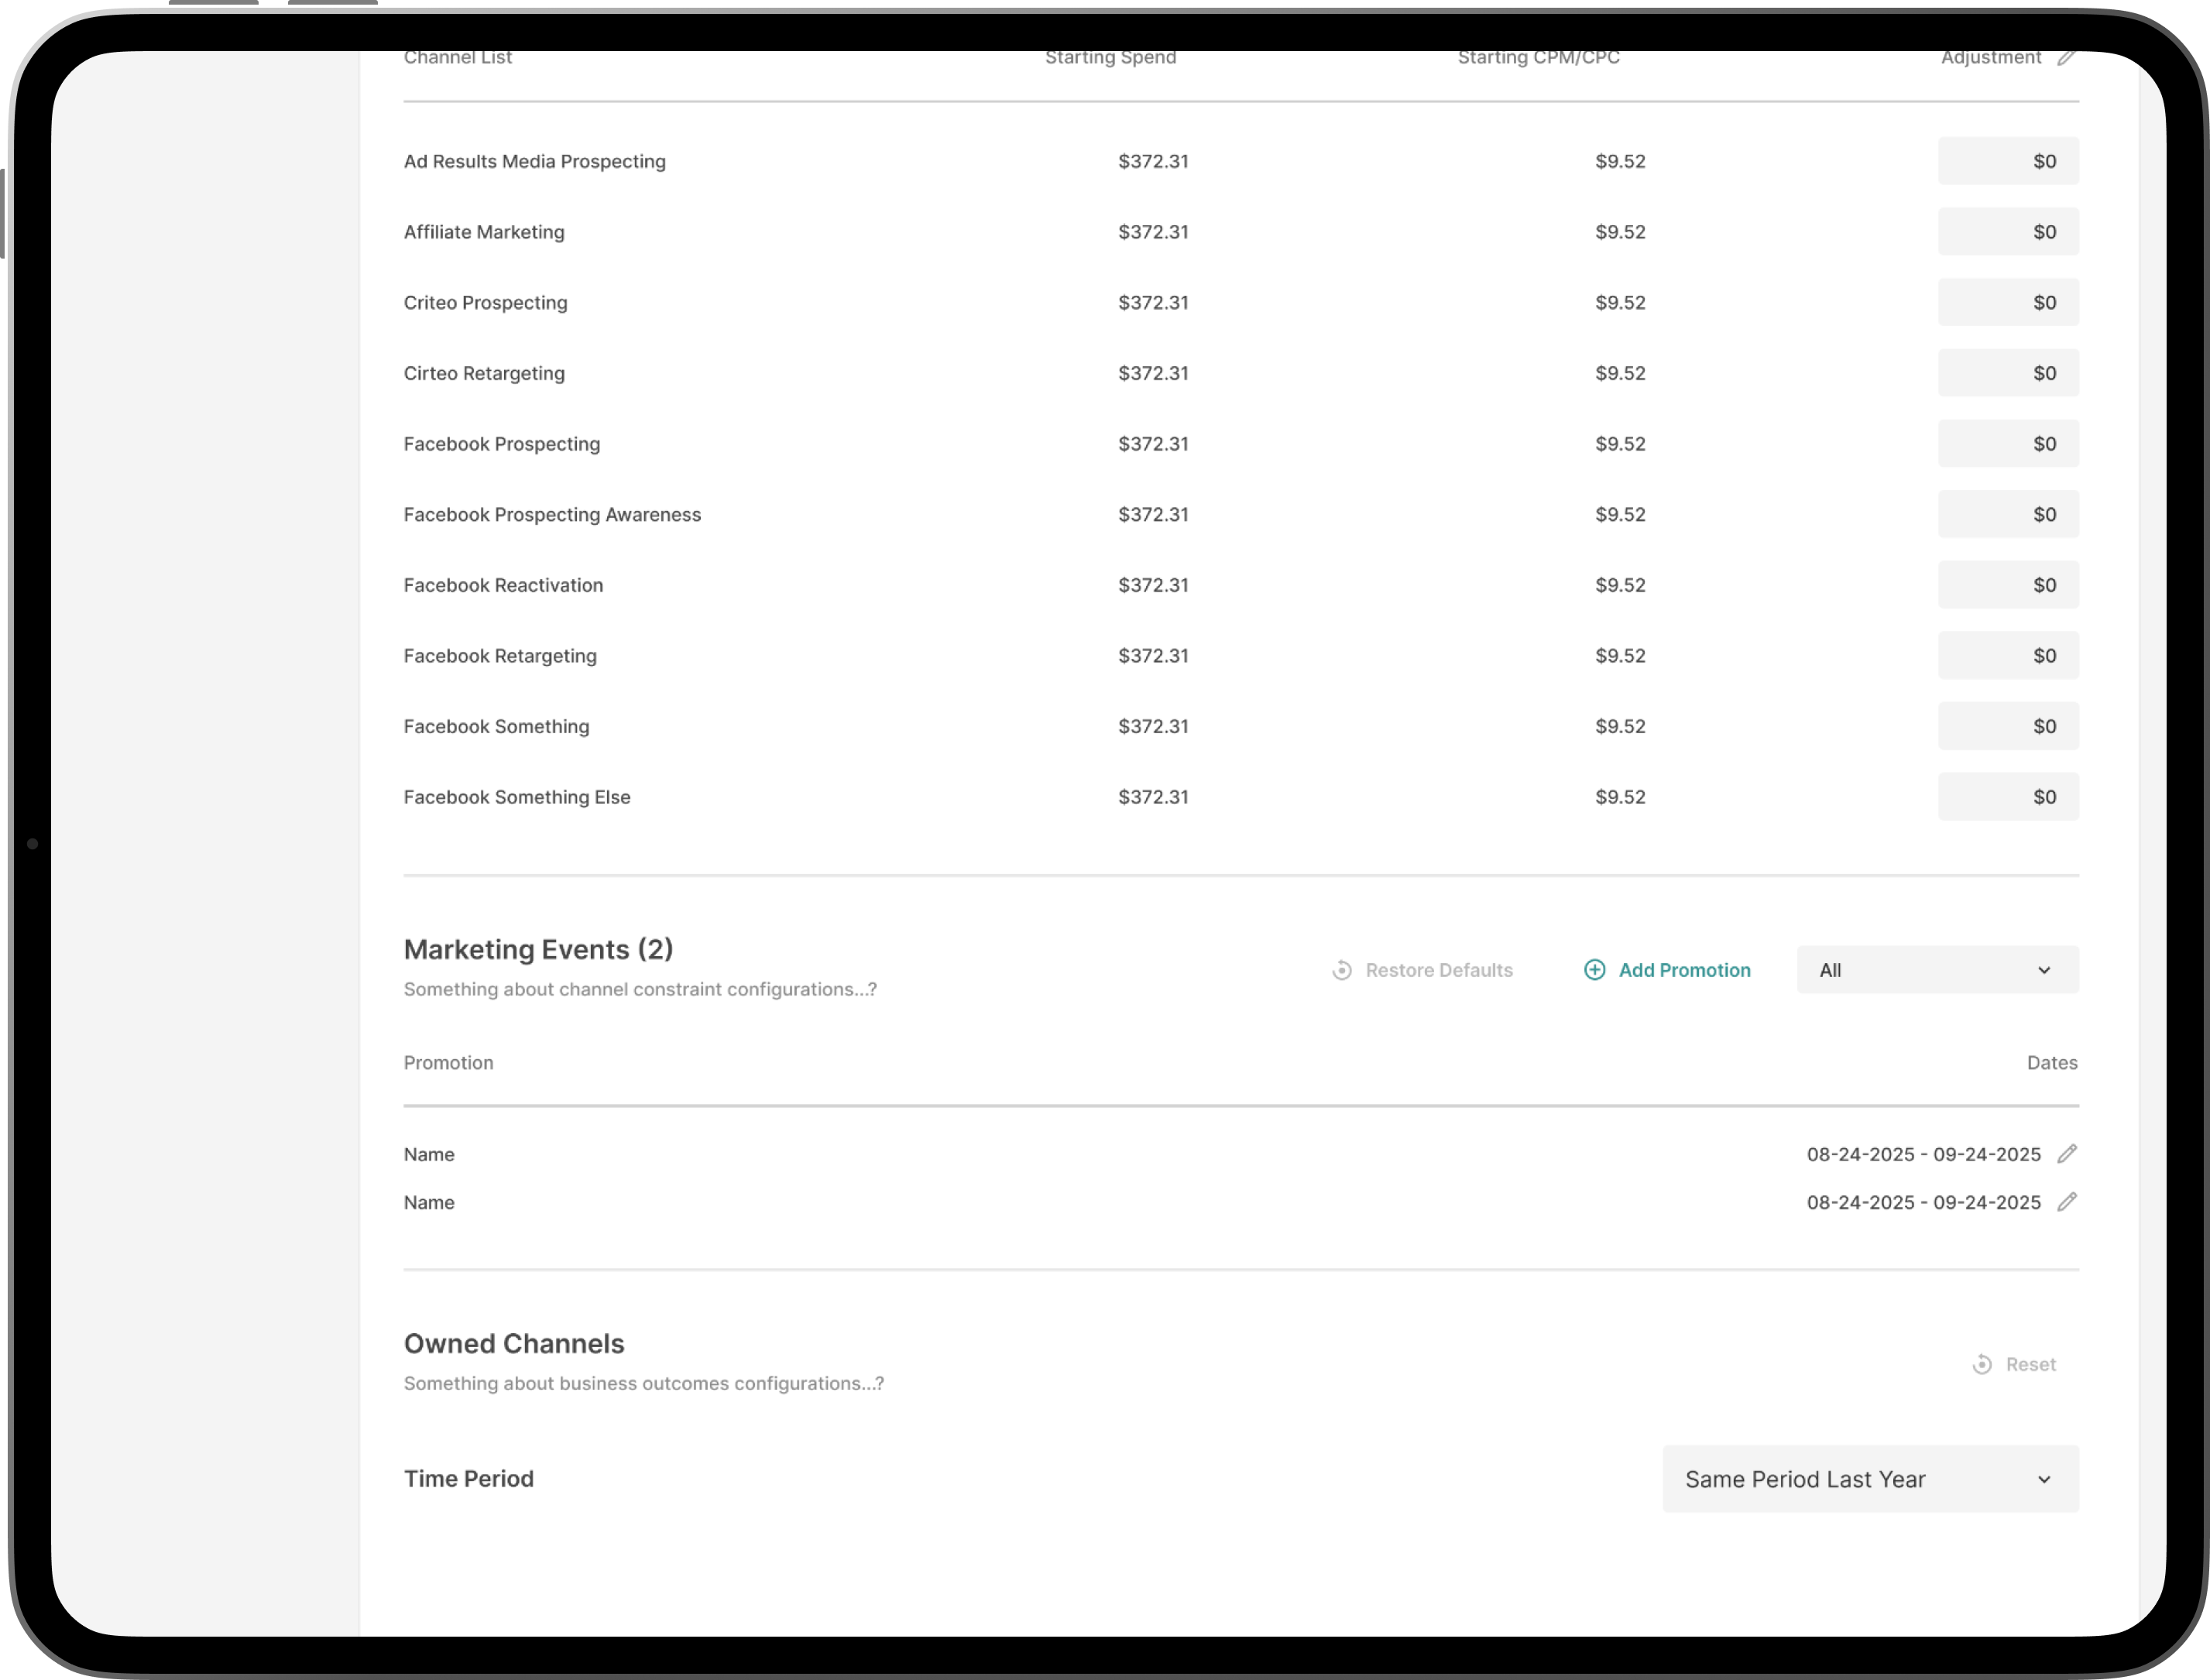
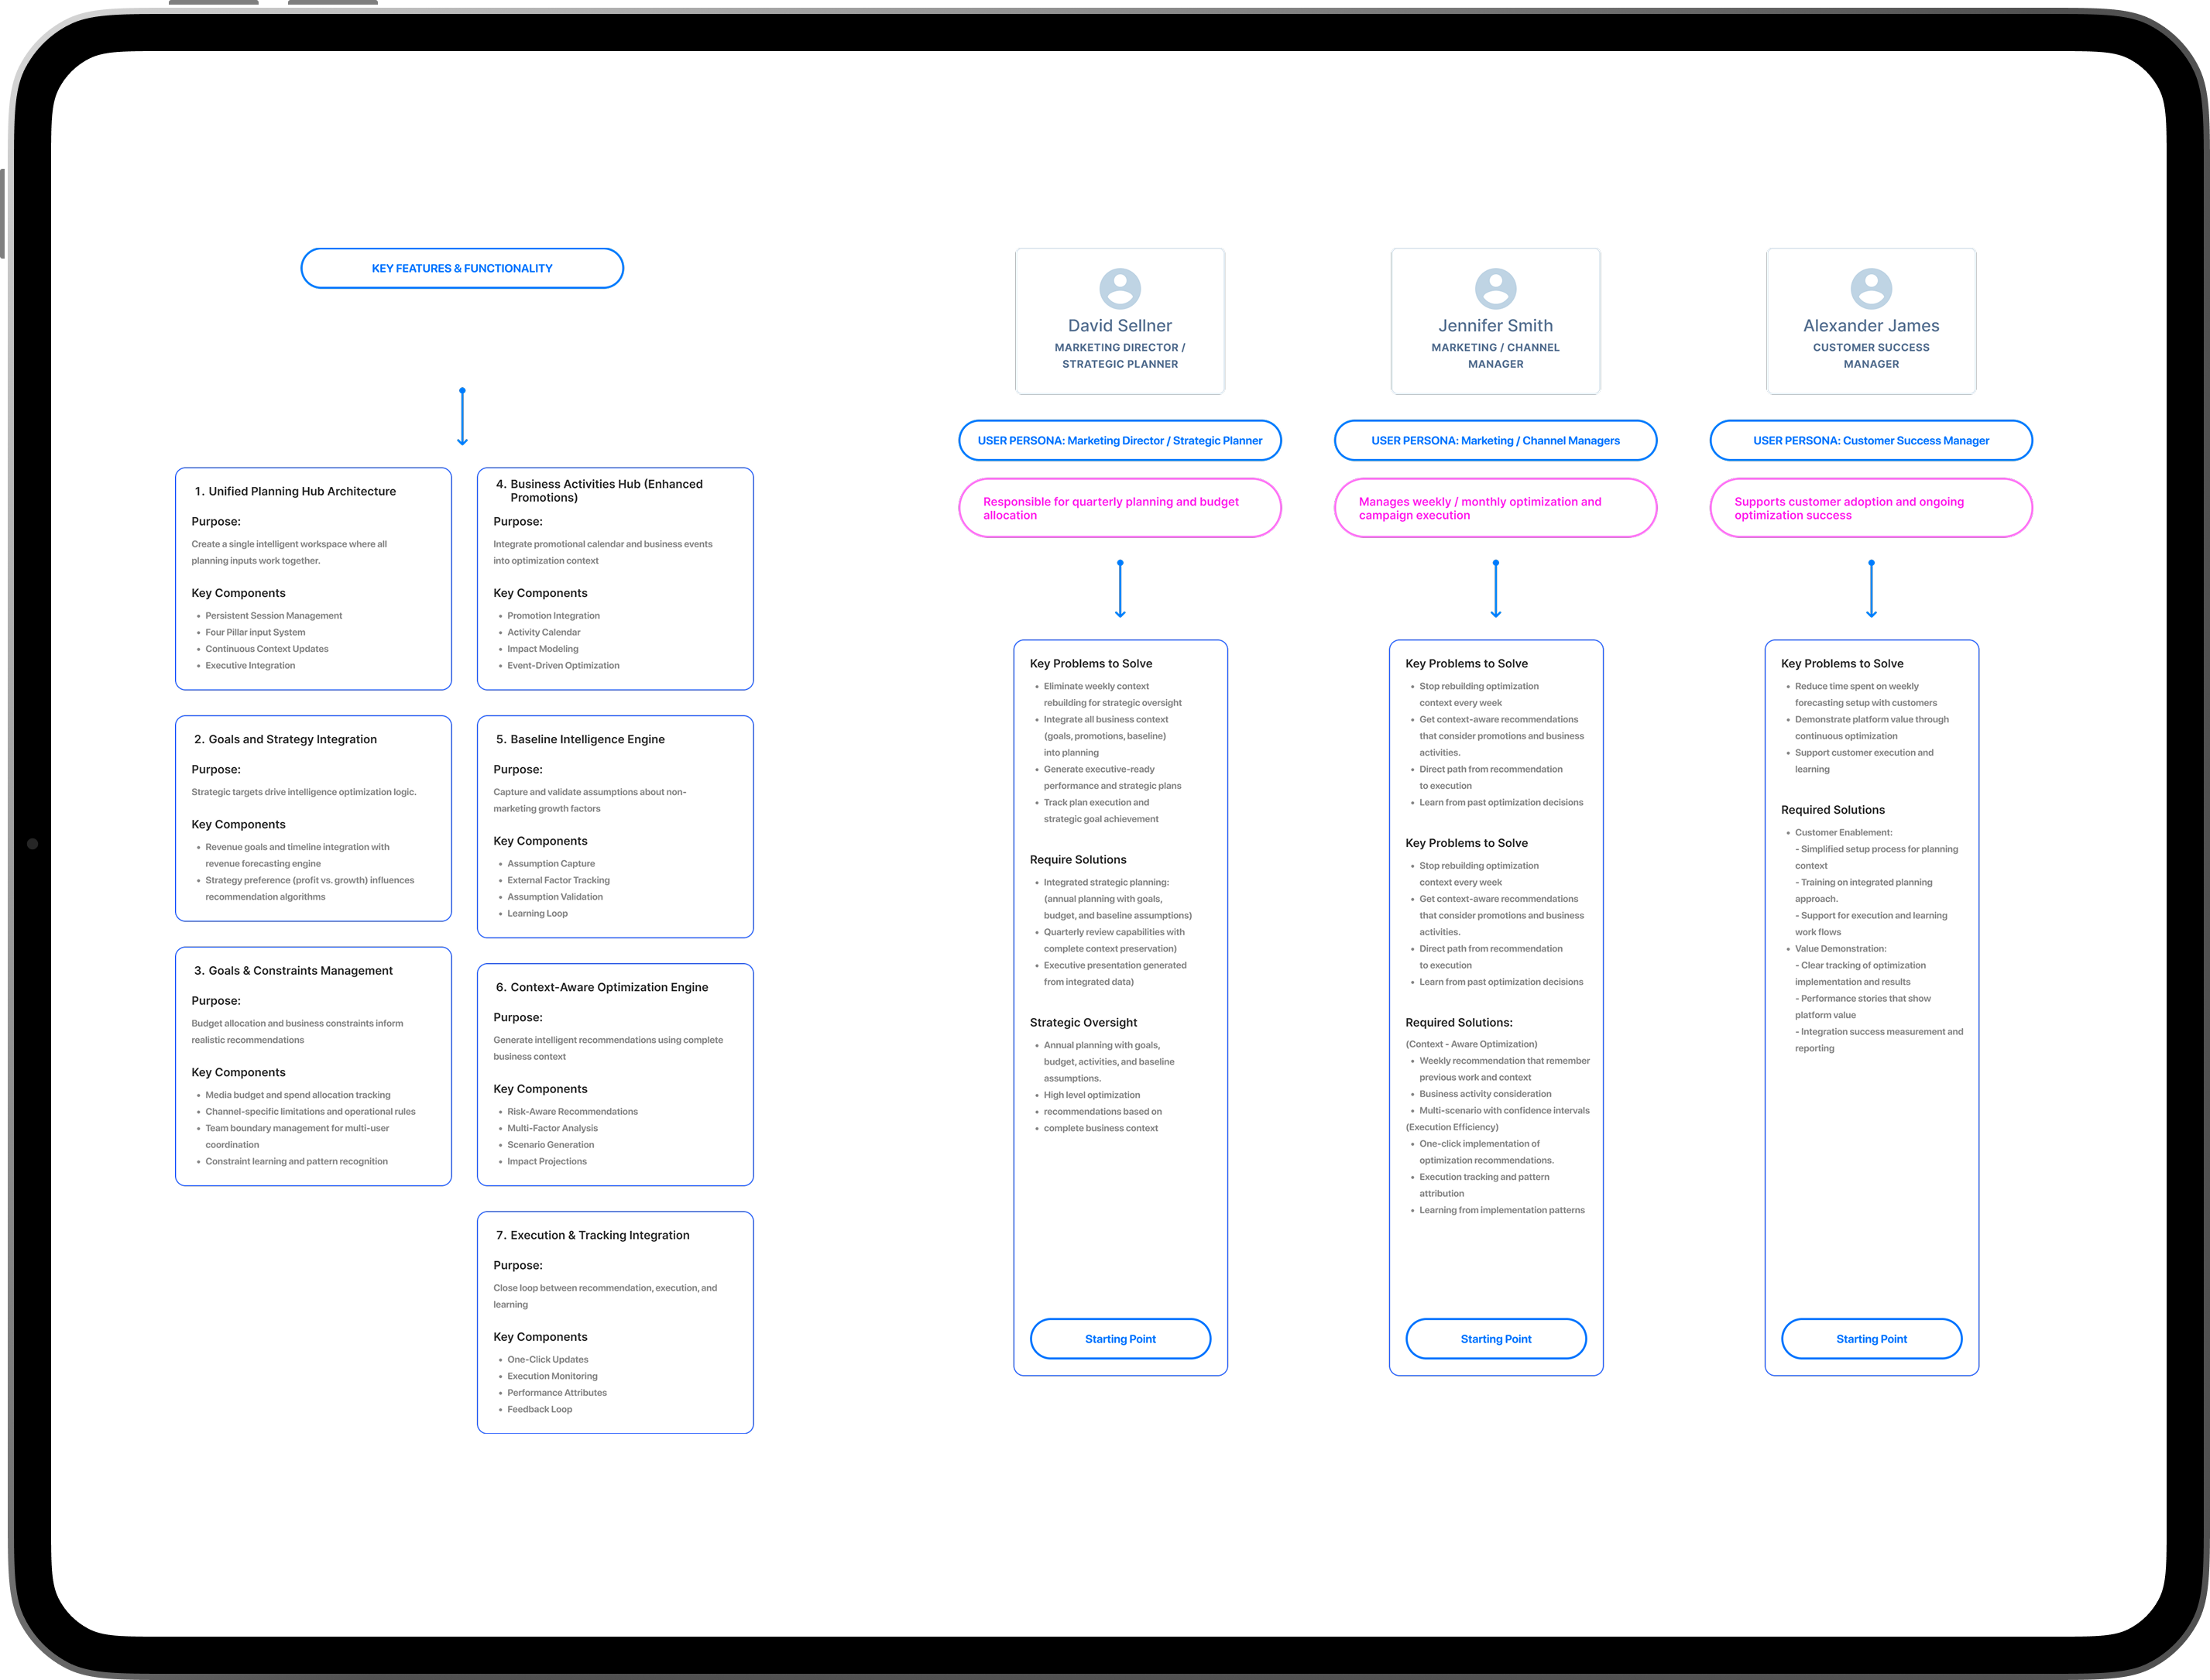
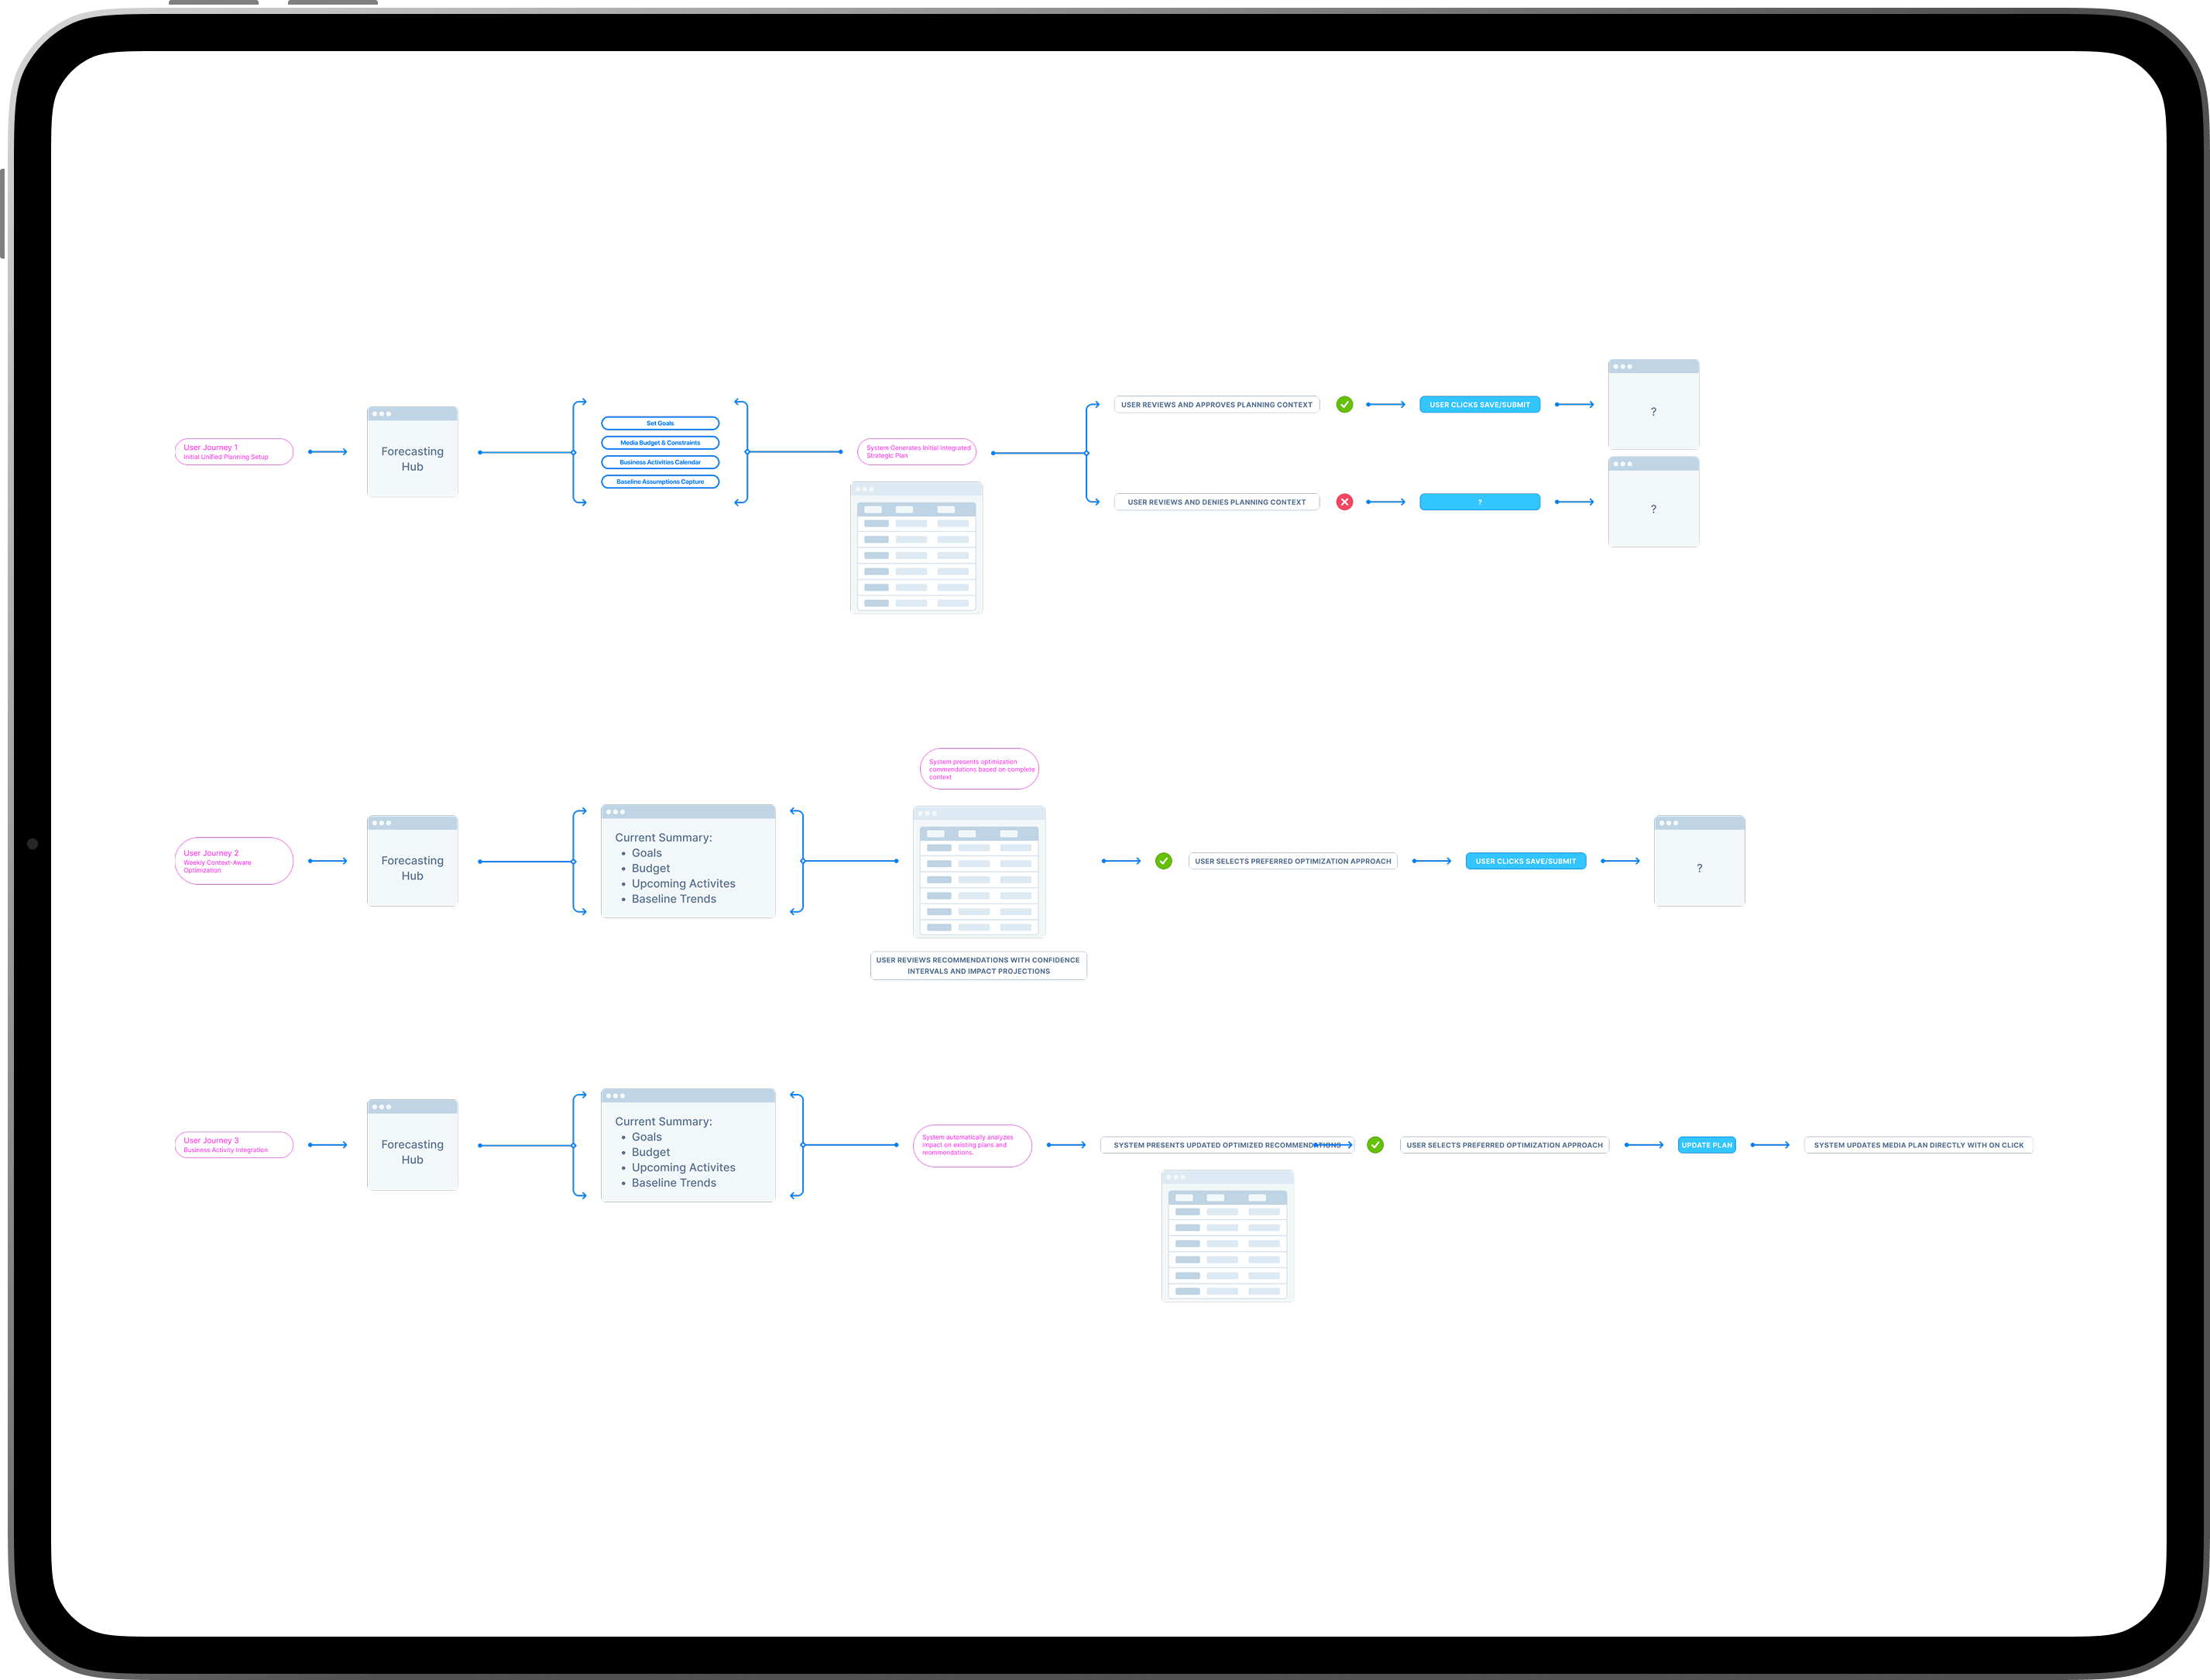
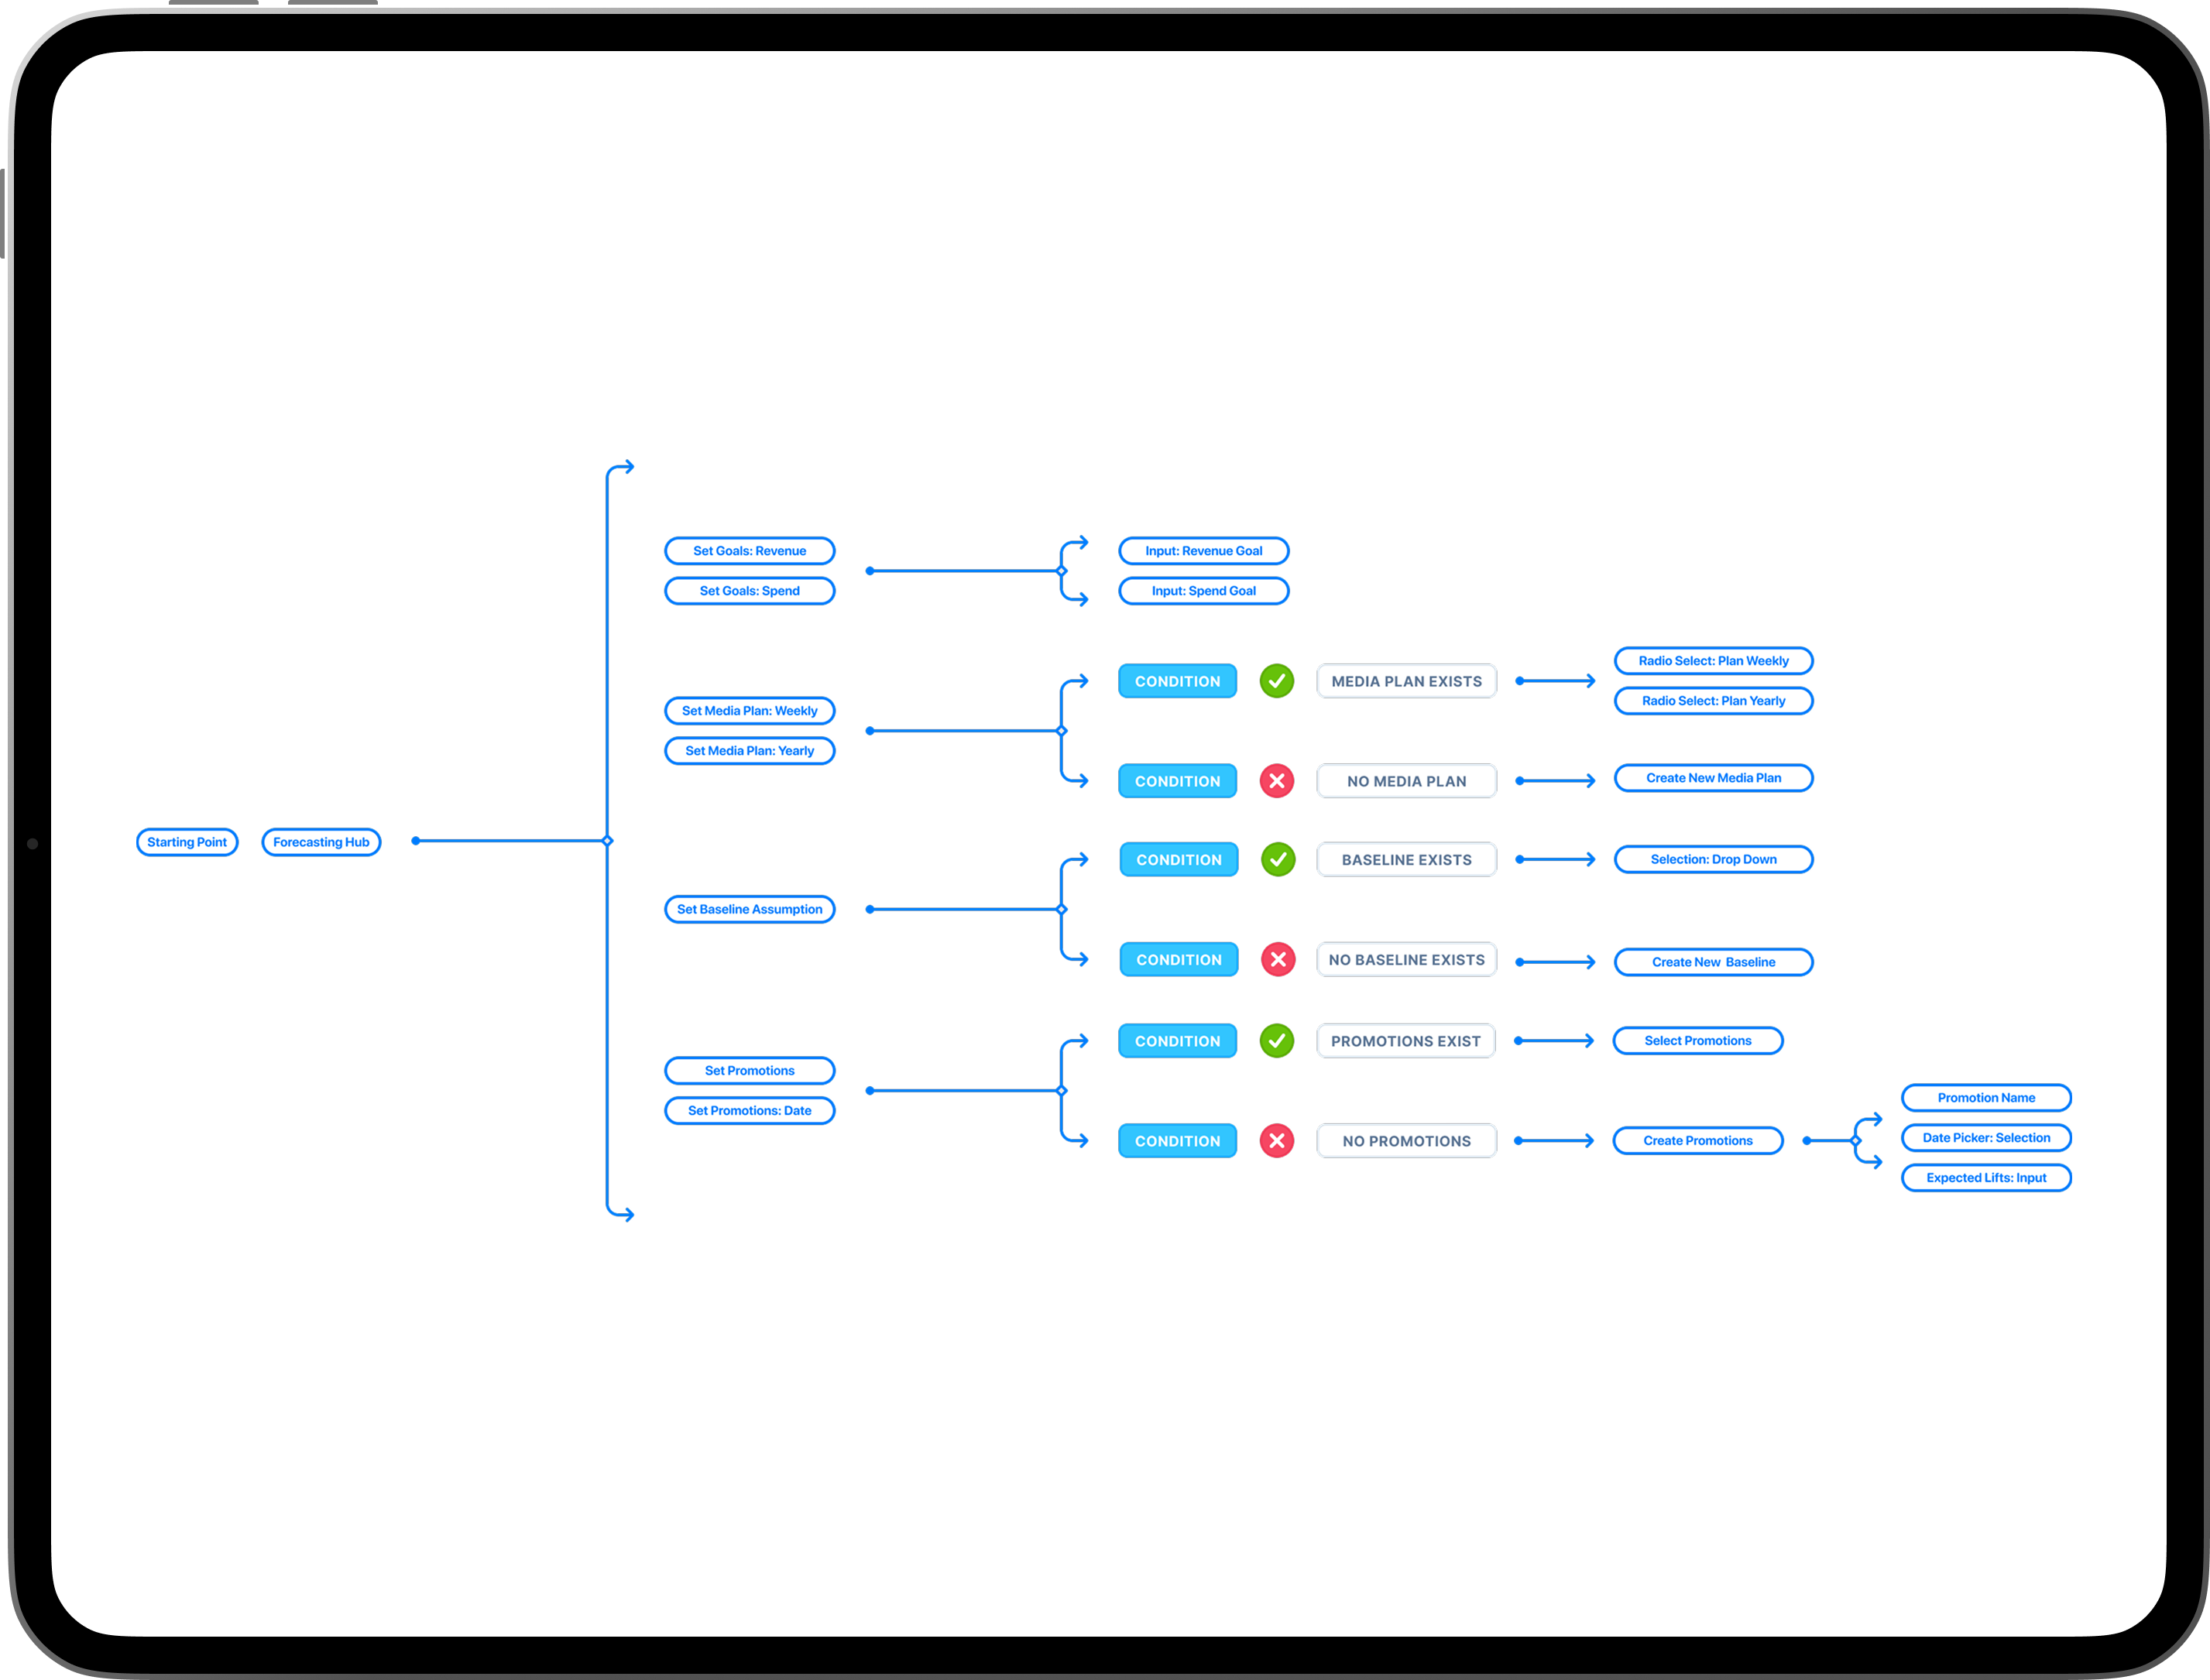
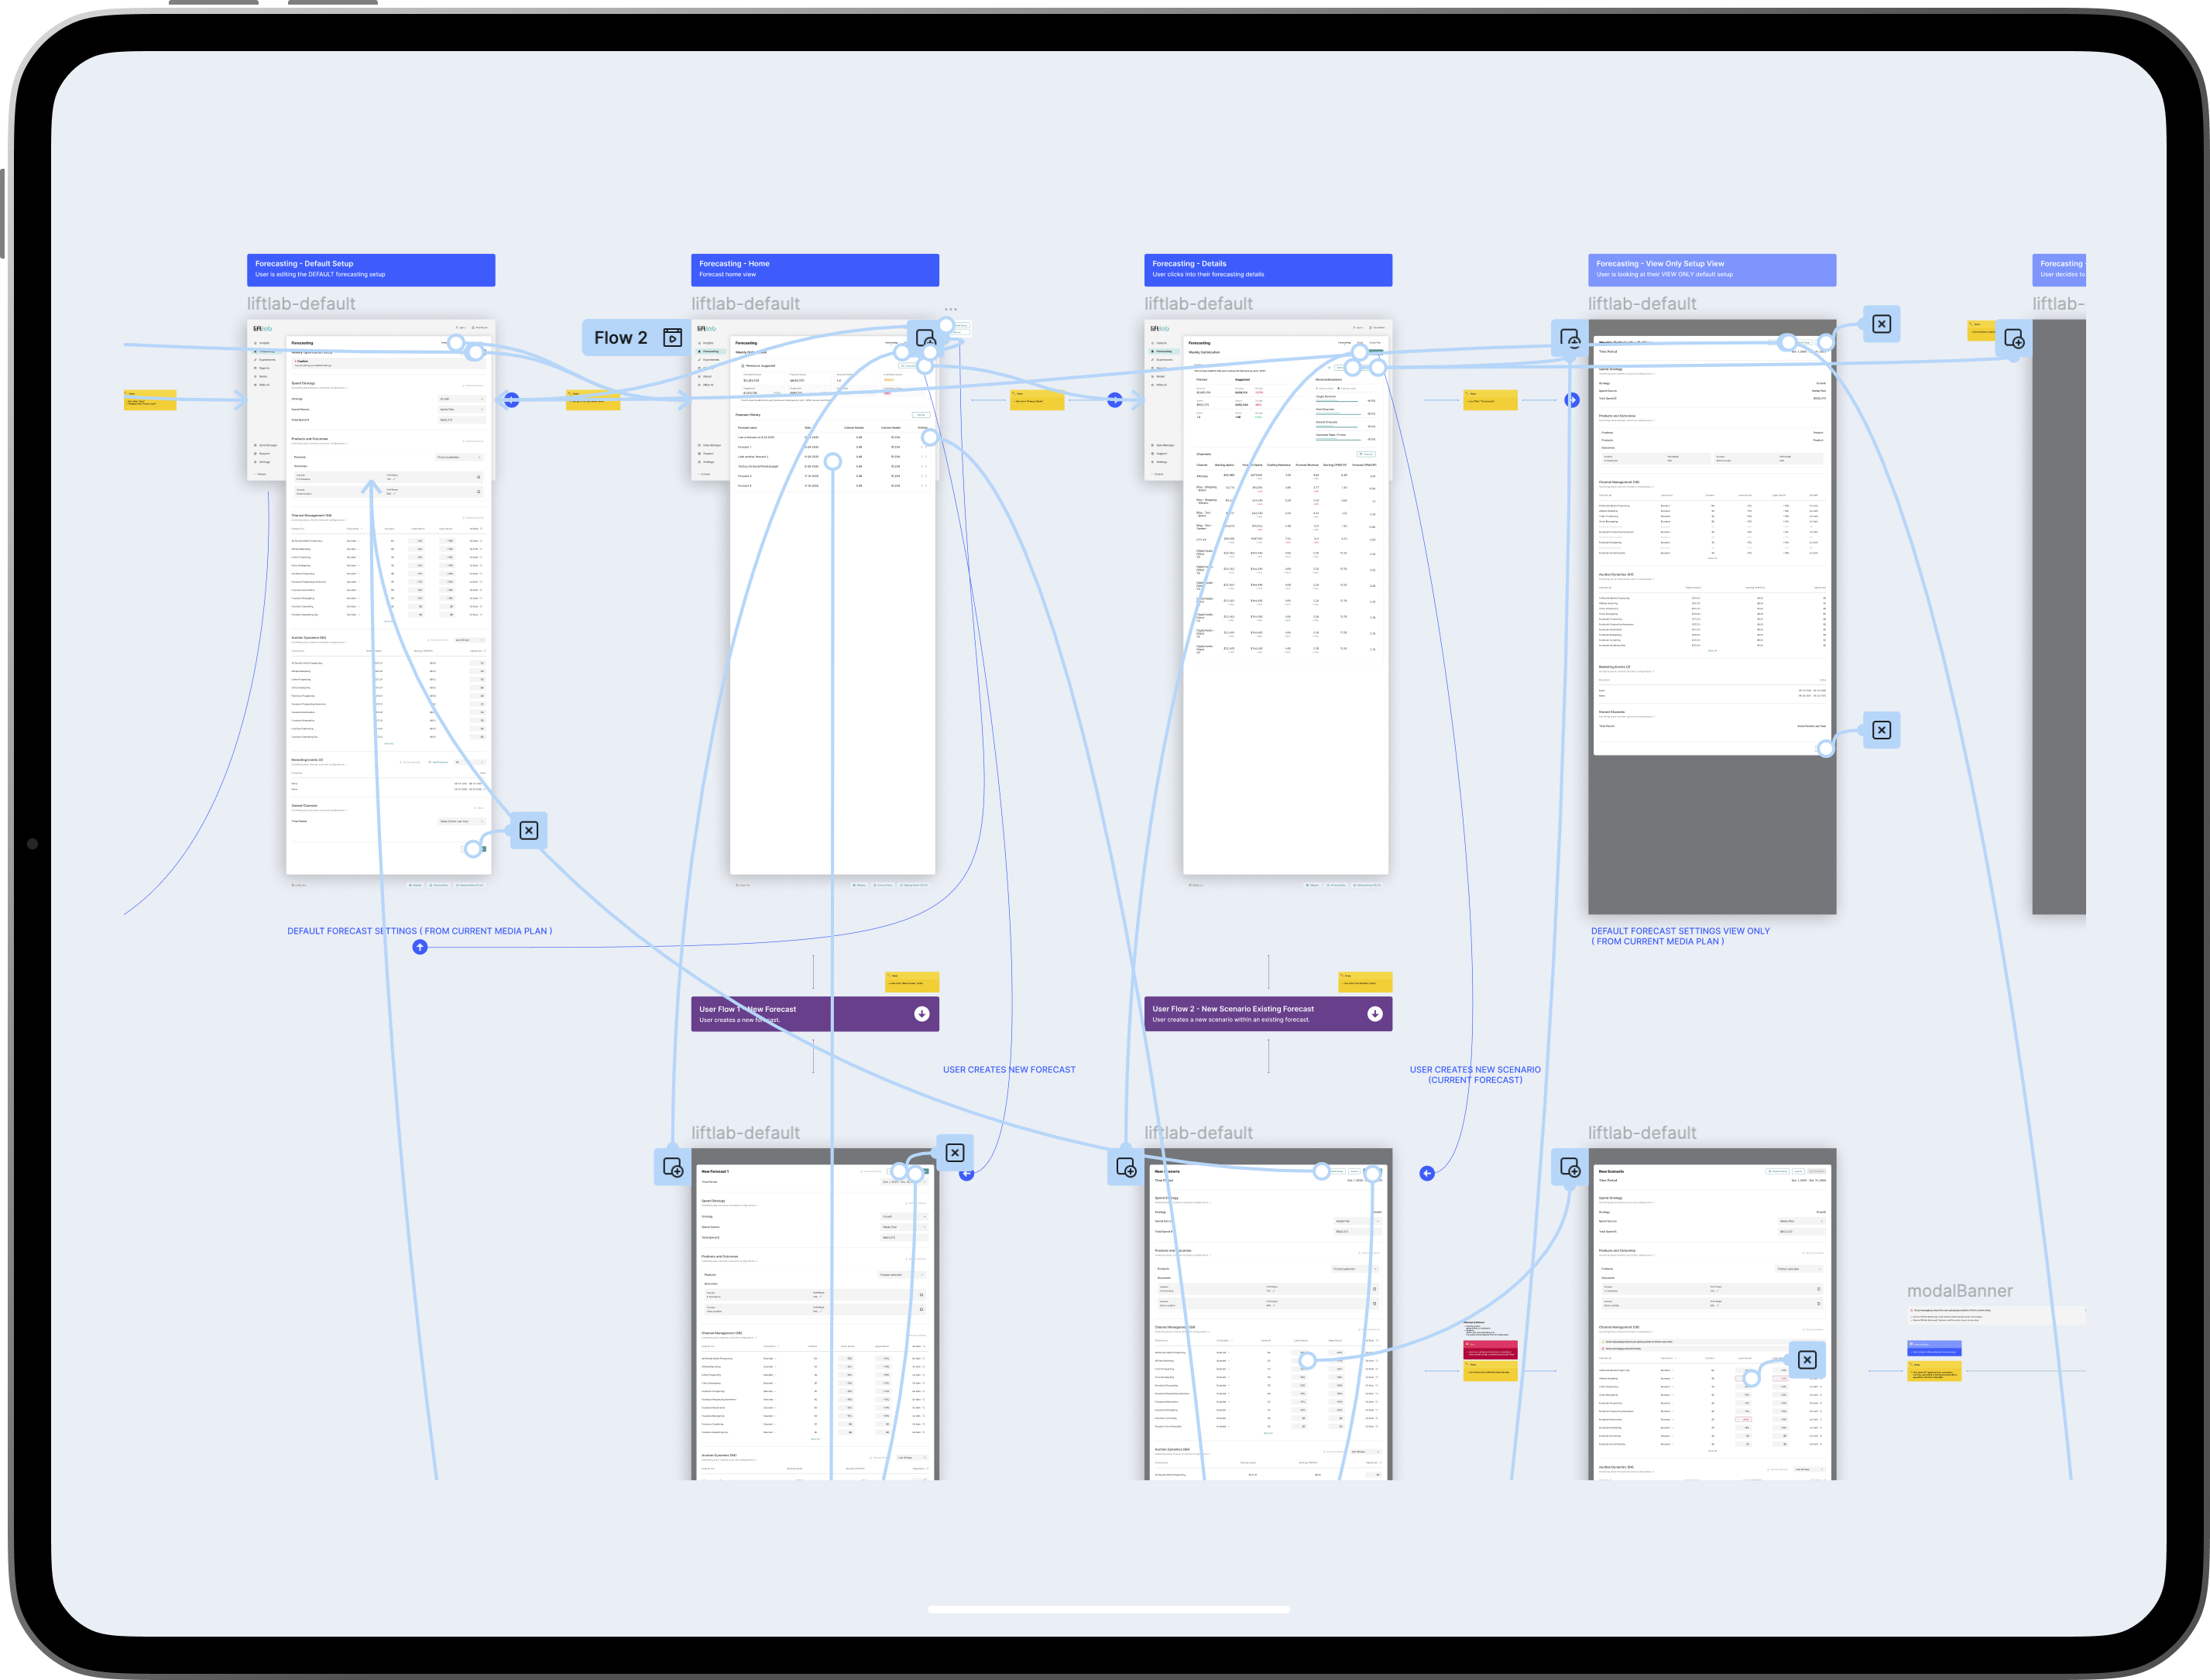
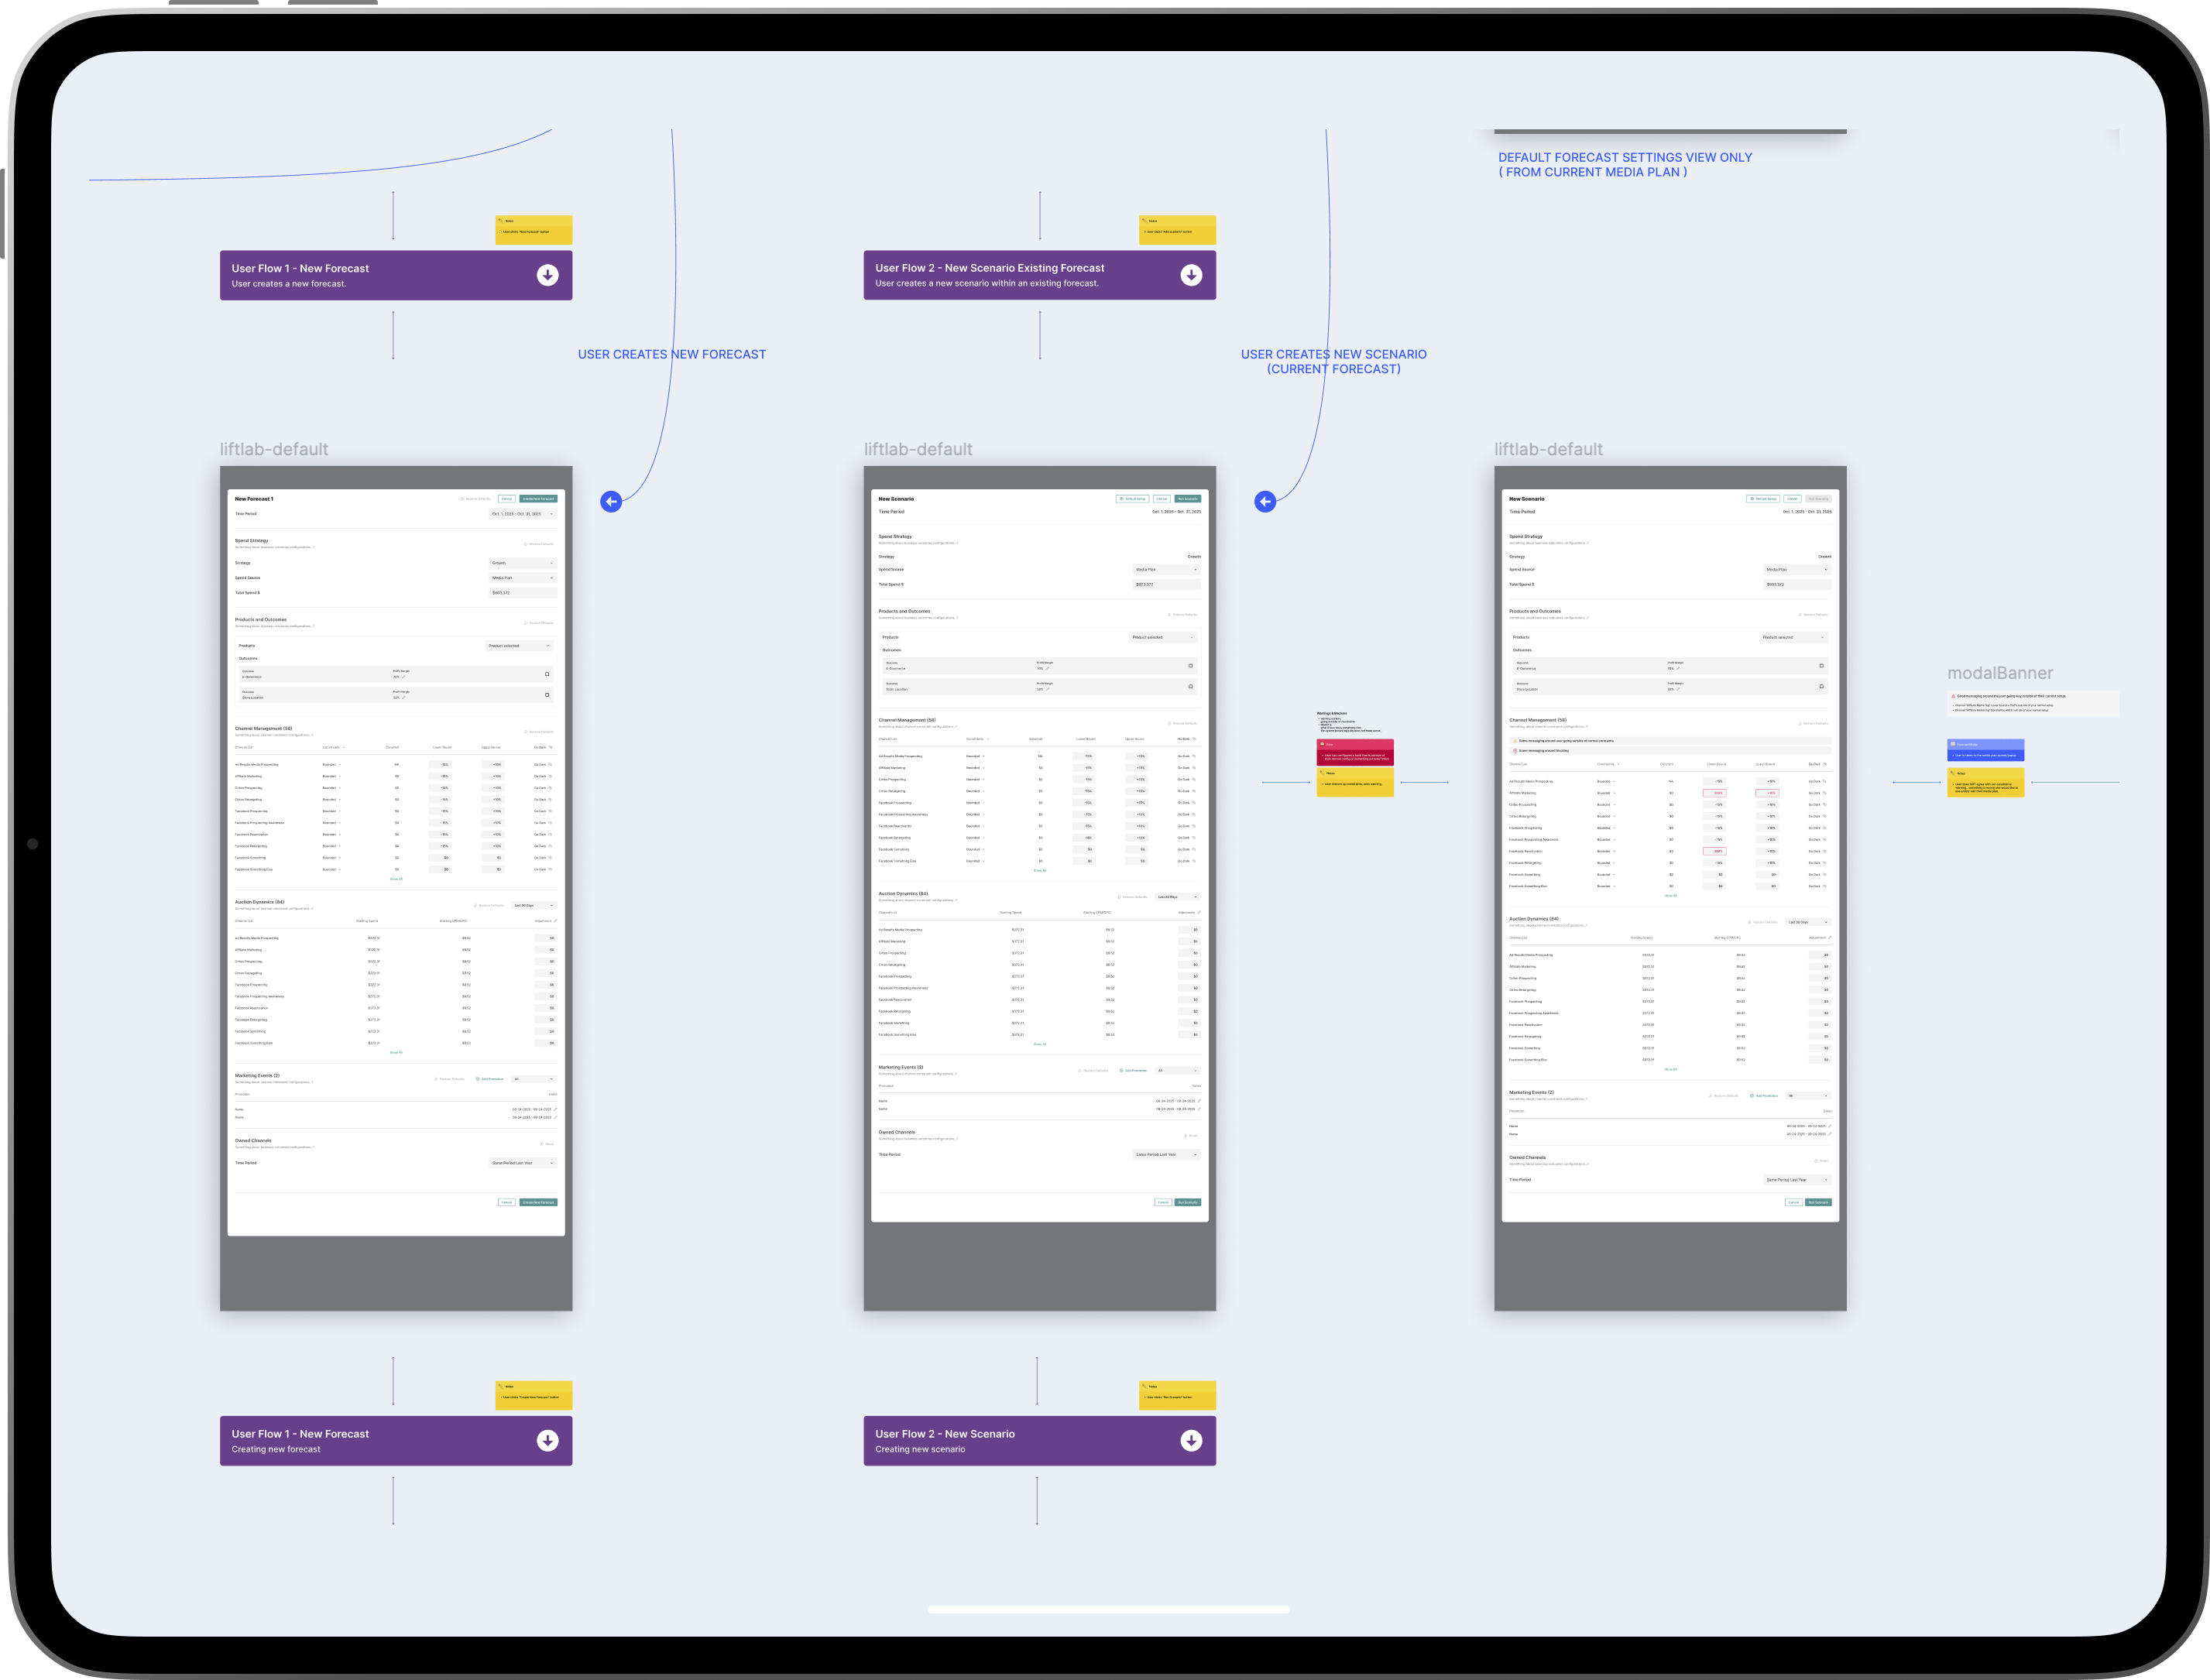
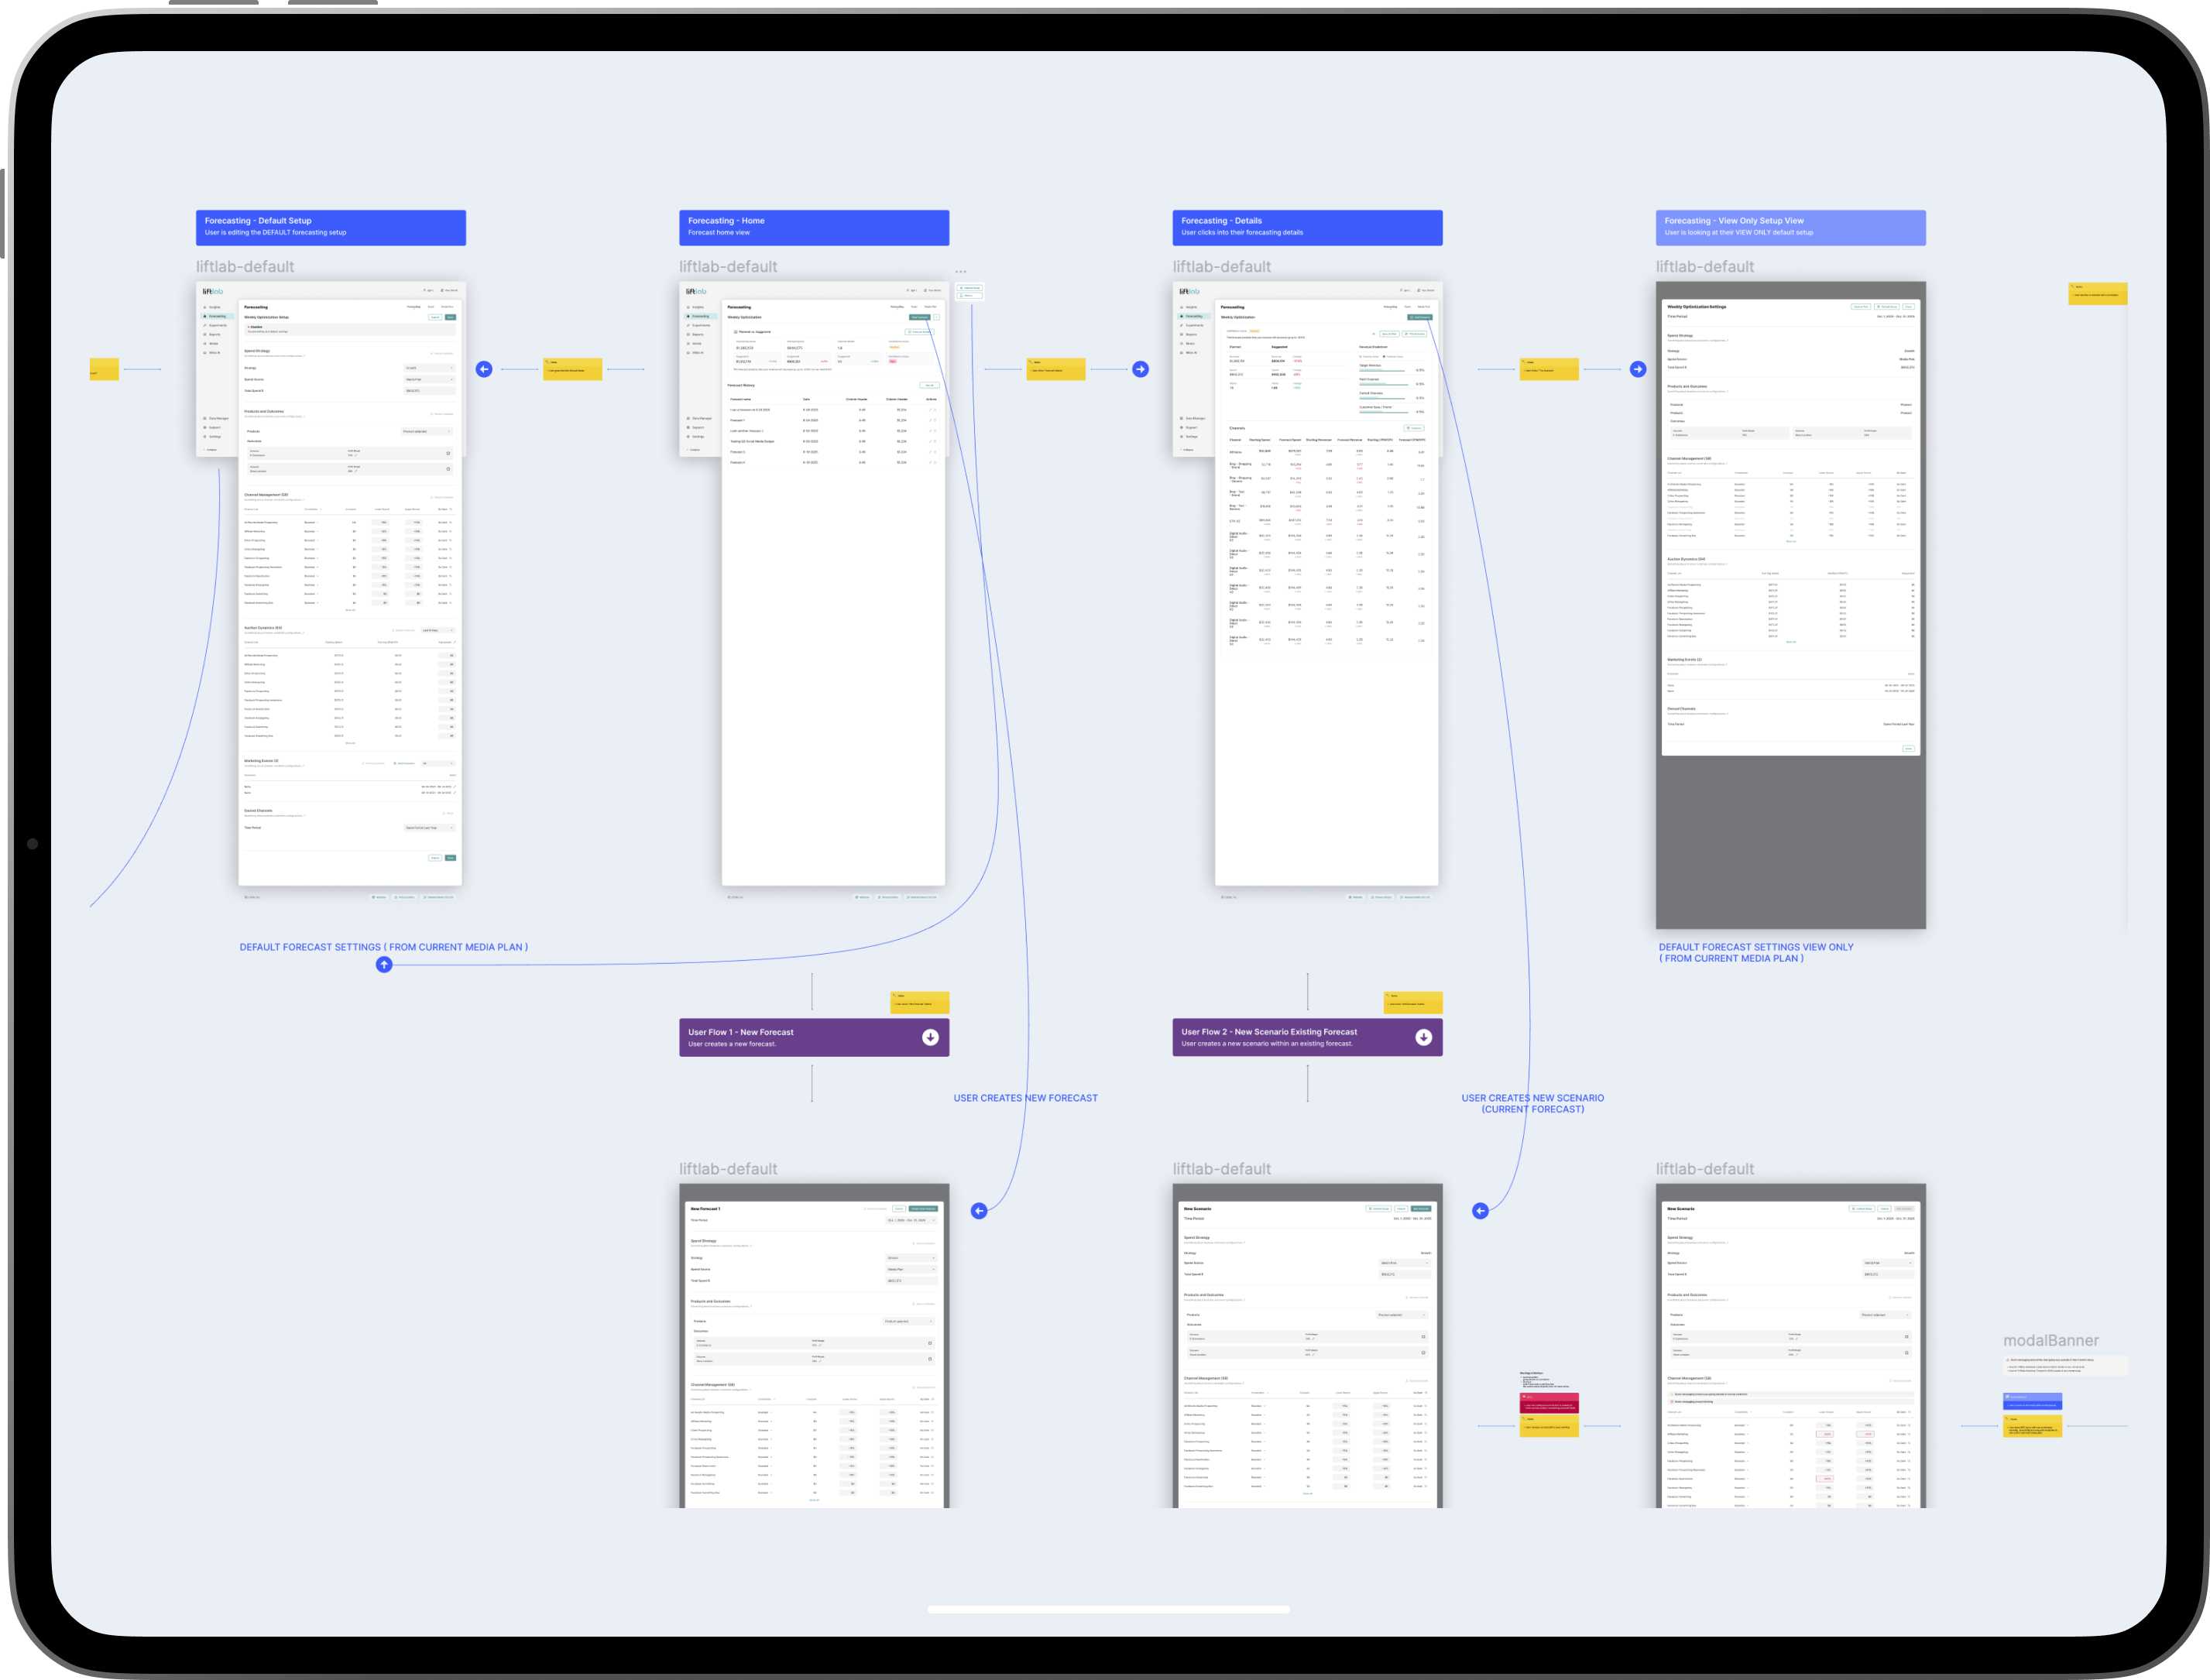
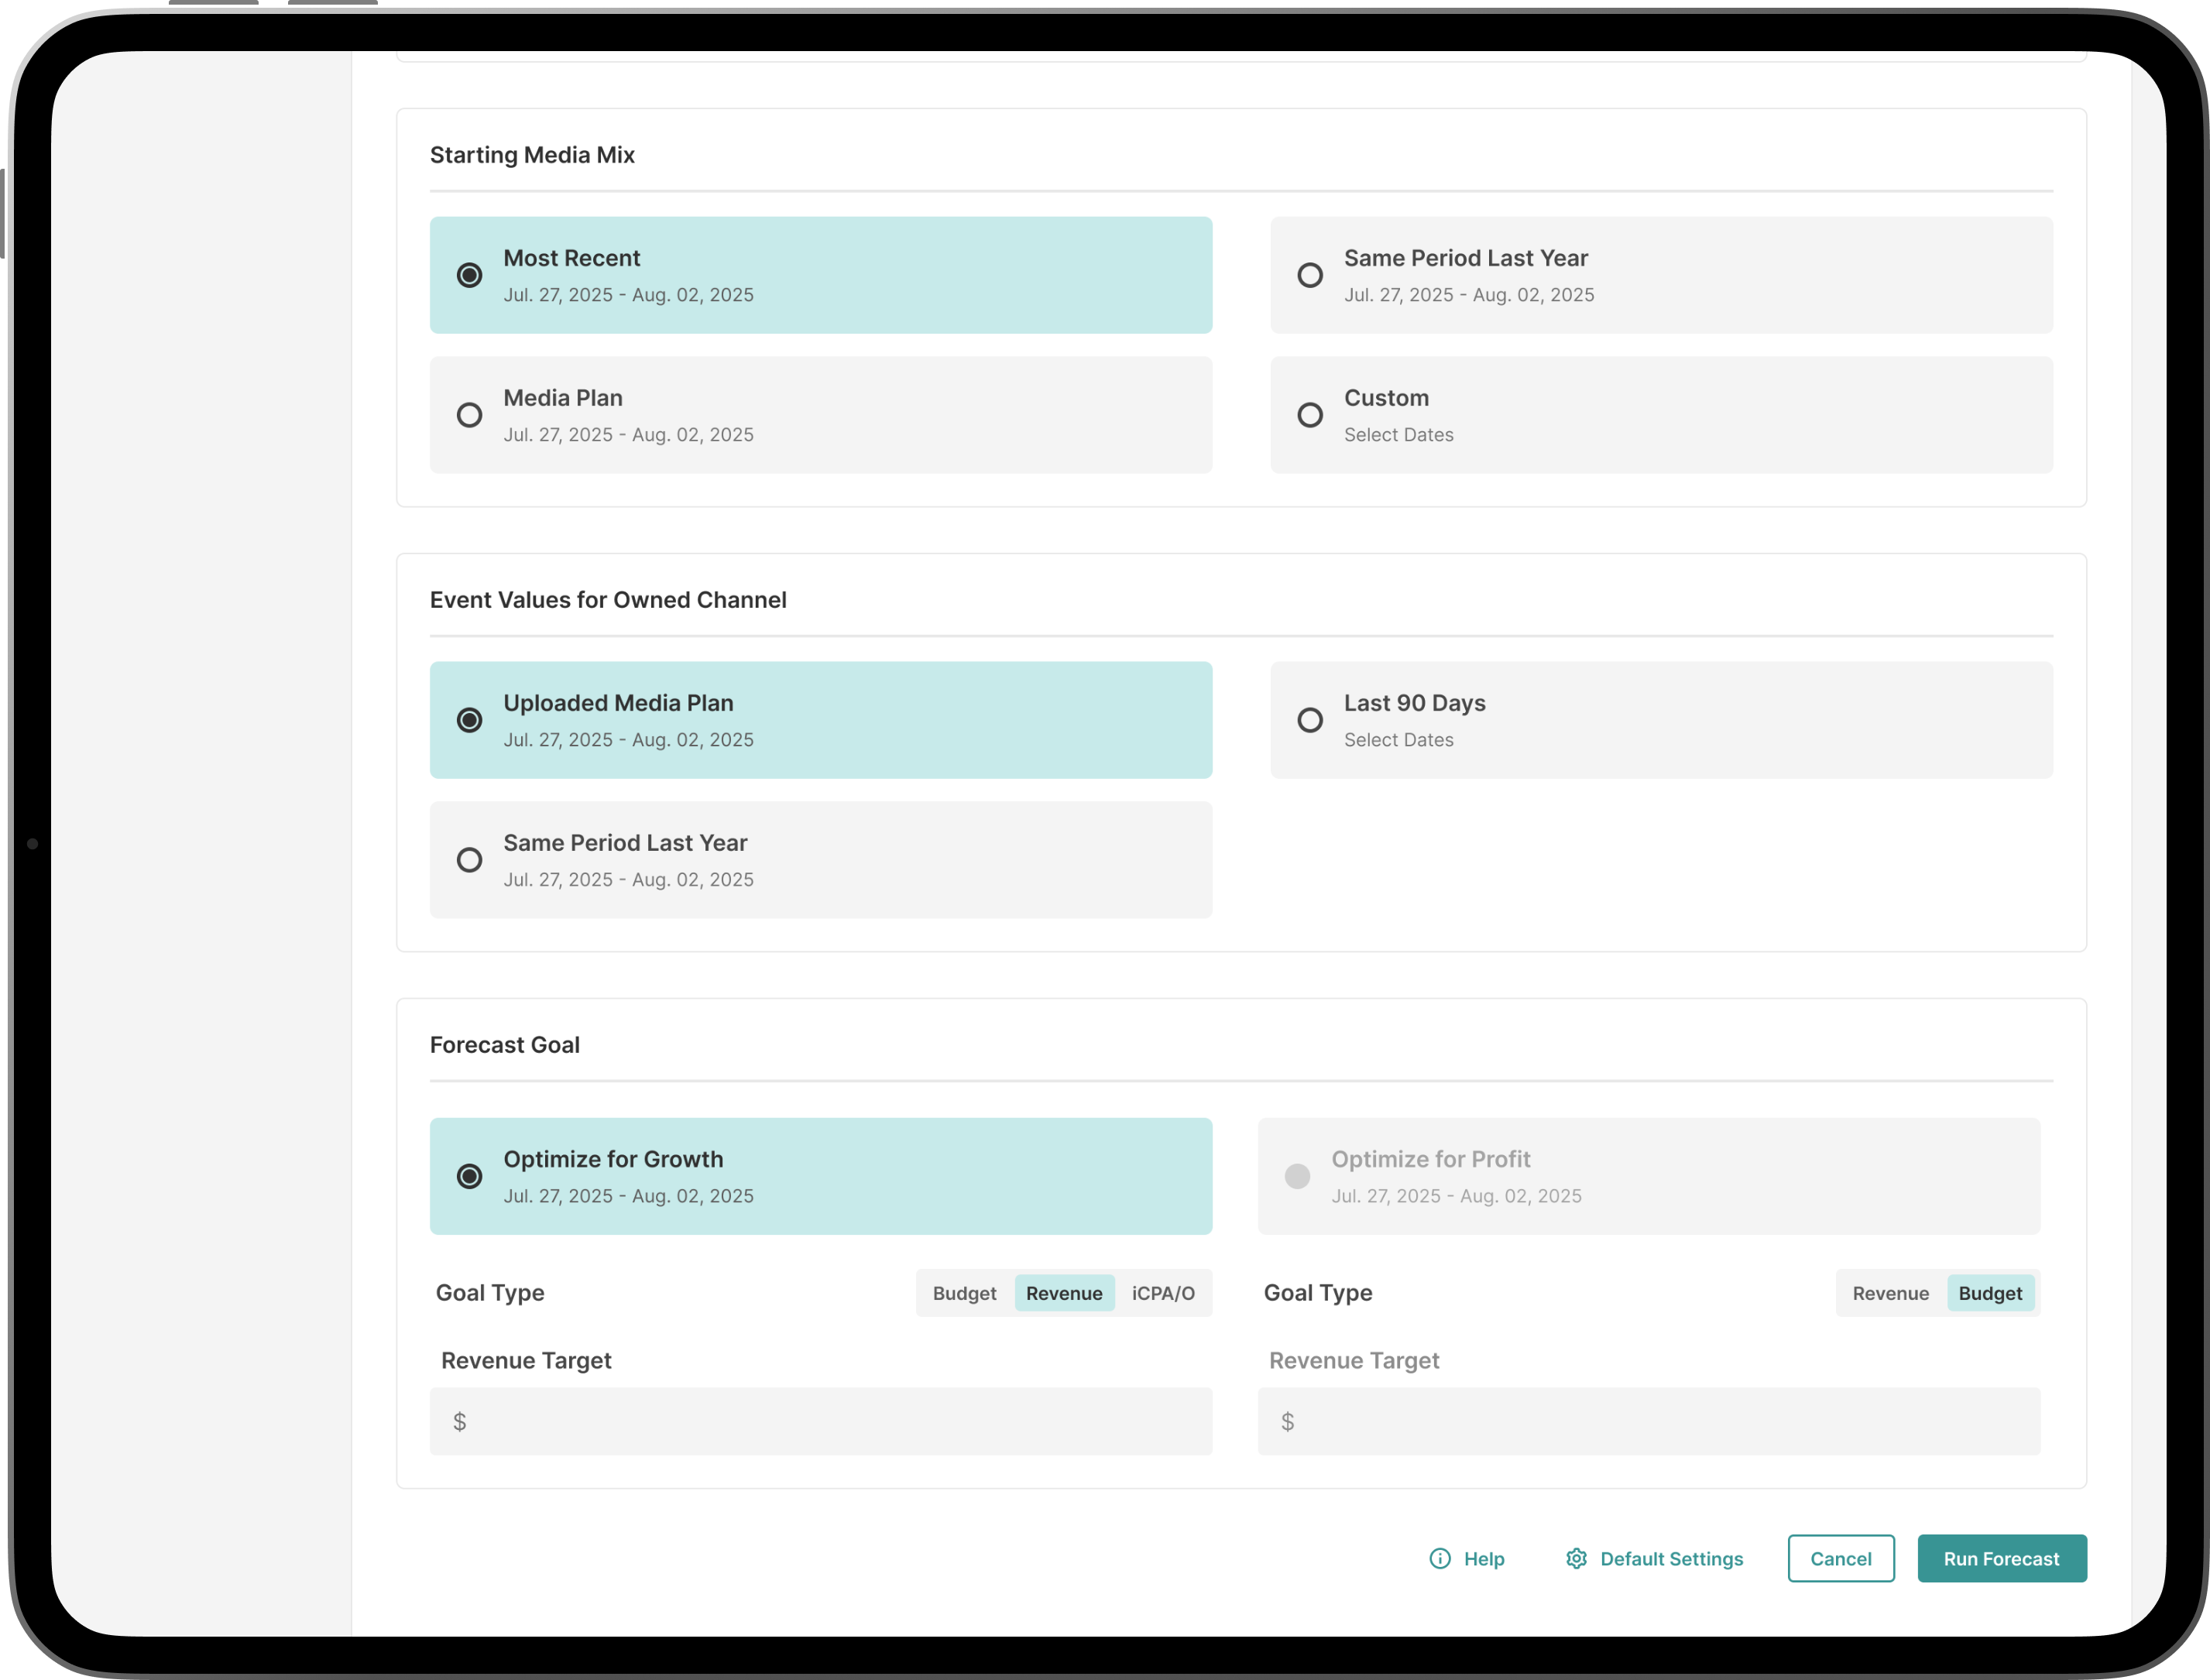
One of LiftLab’s core features is a marketing budget forecasting tool. This enables enterprise marketing teams to forecast their digital and print media marketing budget results such as profit, revenue, brand awareness, cost per clicks, customer acquisition costs, etc... The tool was designed a super long time ago and was using an outdated design system. Working with the entire org I helped lead and design the new LiftLab forecasting tool which helped drive user engagement, increased forecast accuracy by 43%, increased the speed at which enterprise teams were able to create a quarterly budget by 90% and increased the ACV (average contract value) by 15%
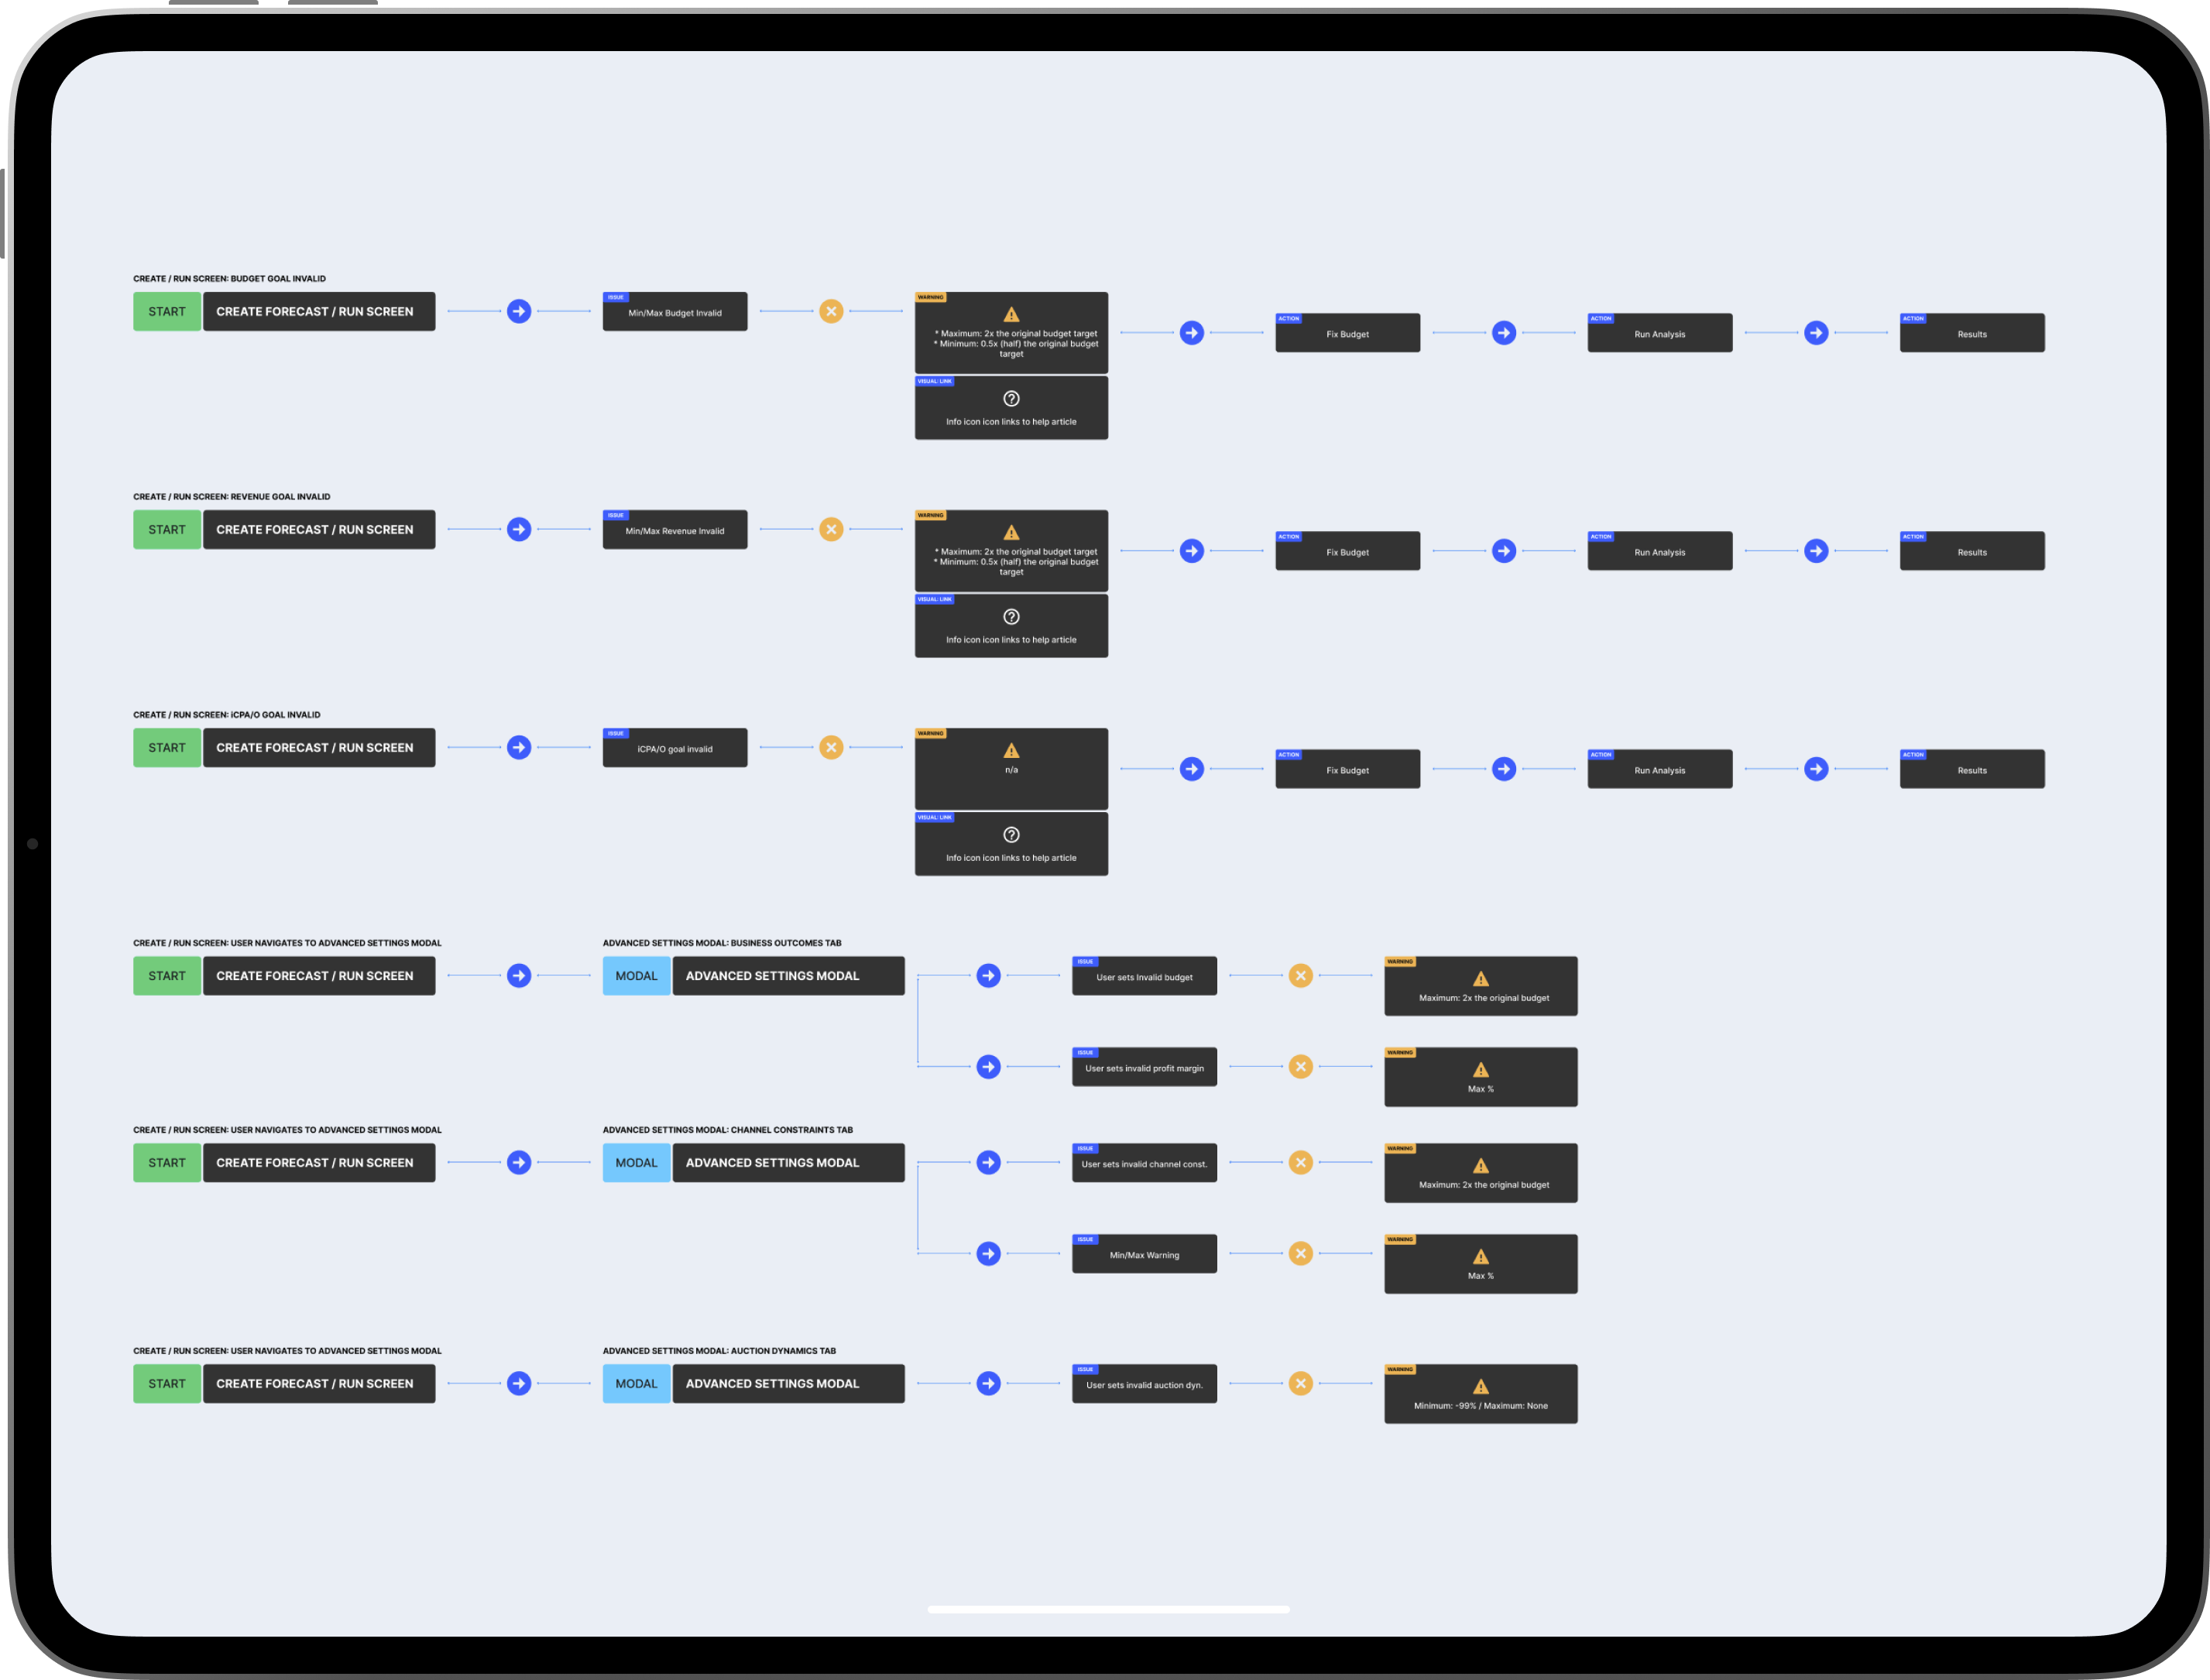
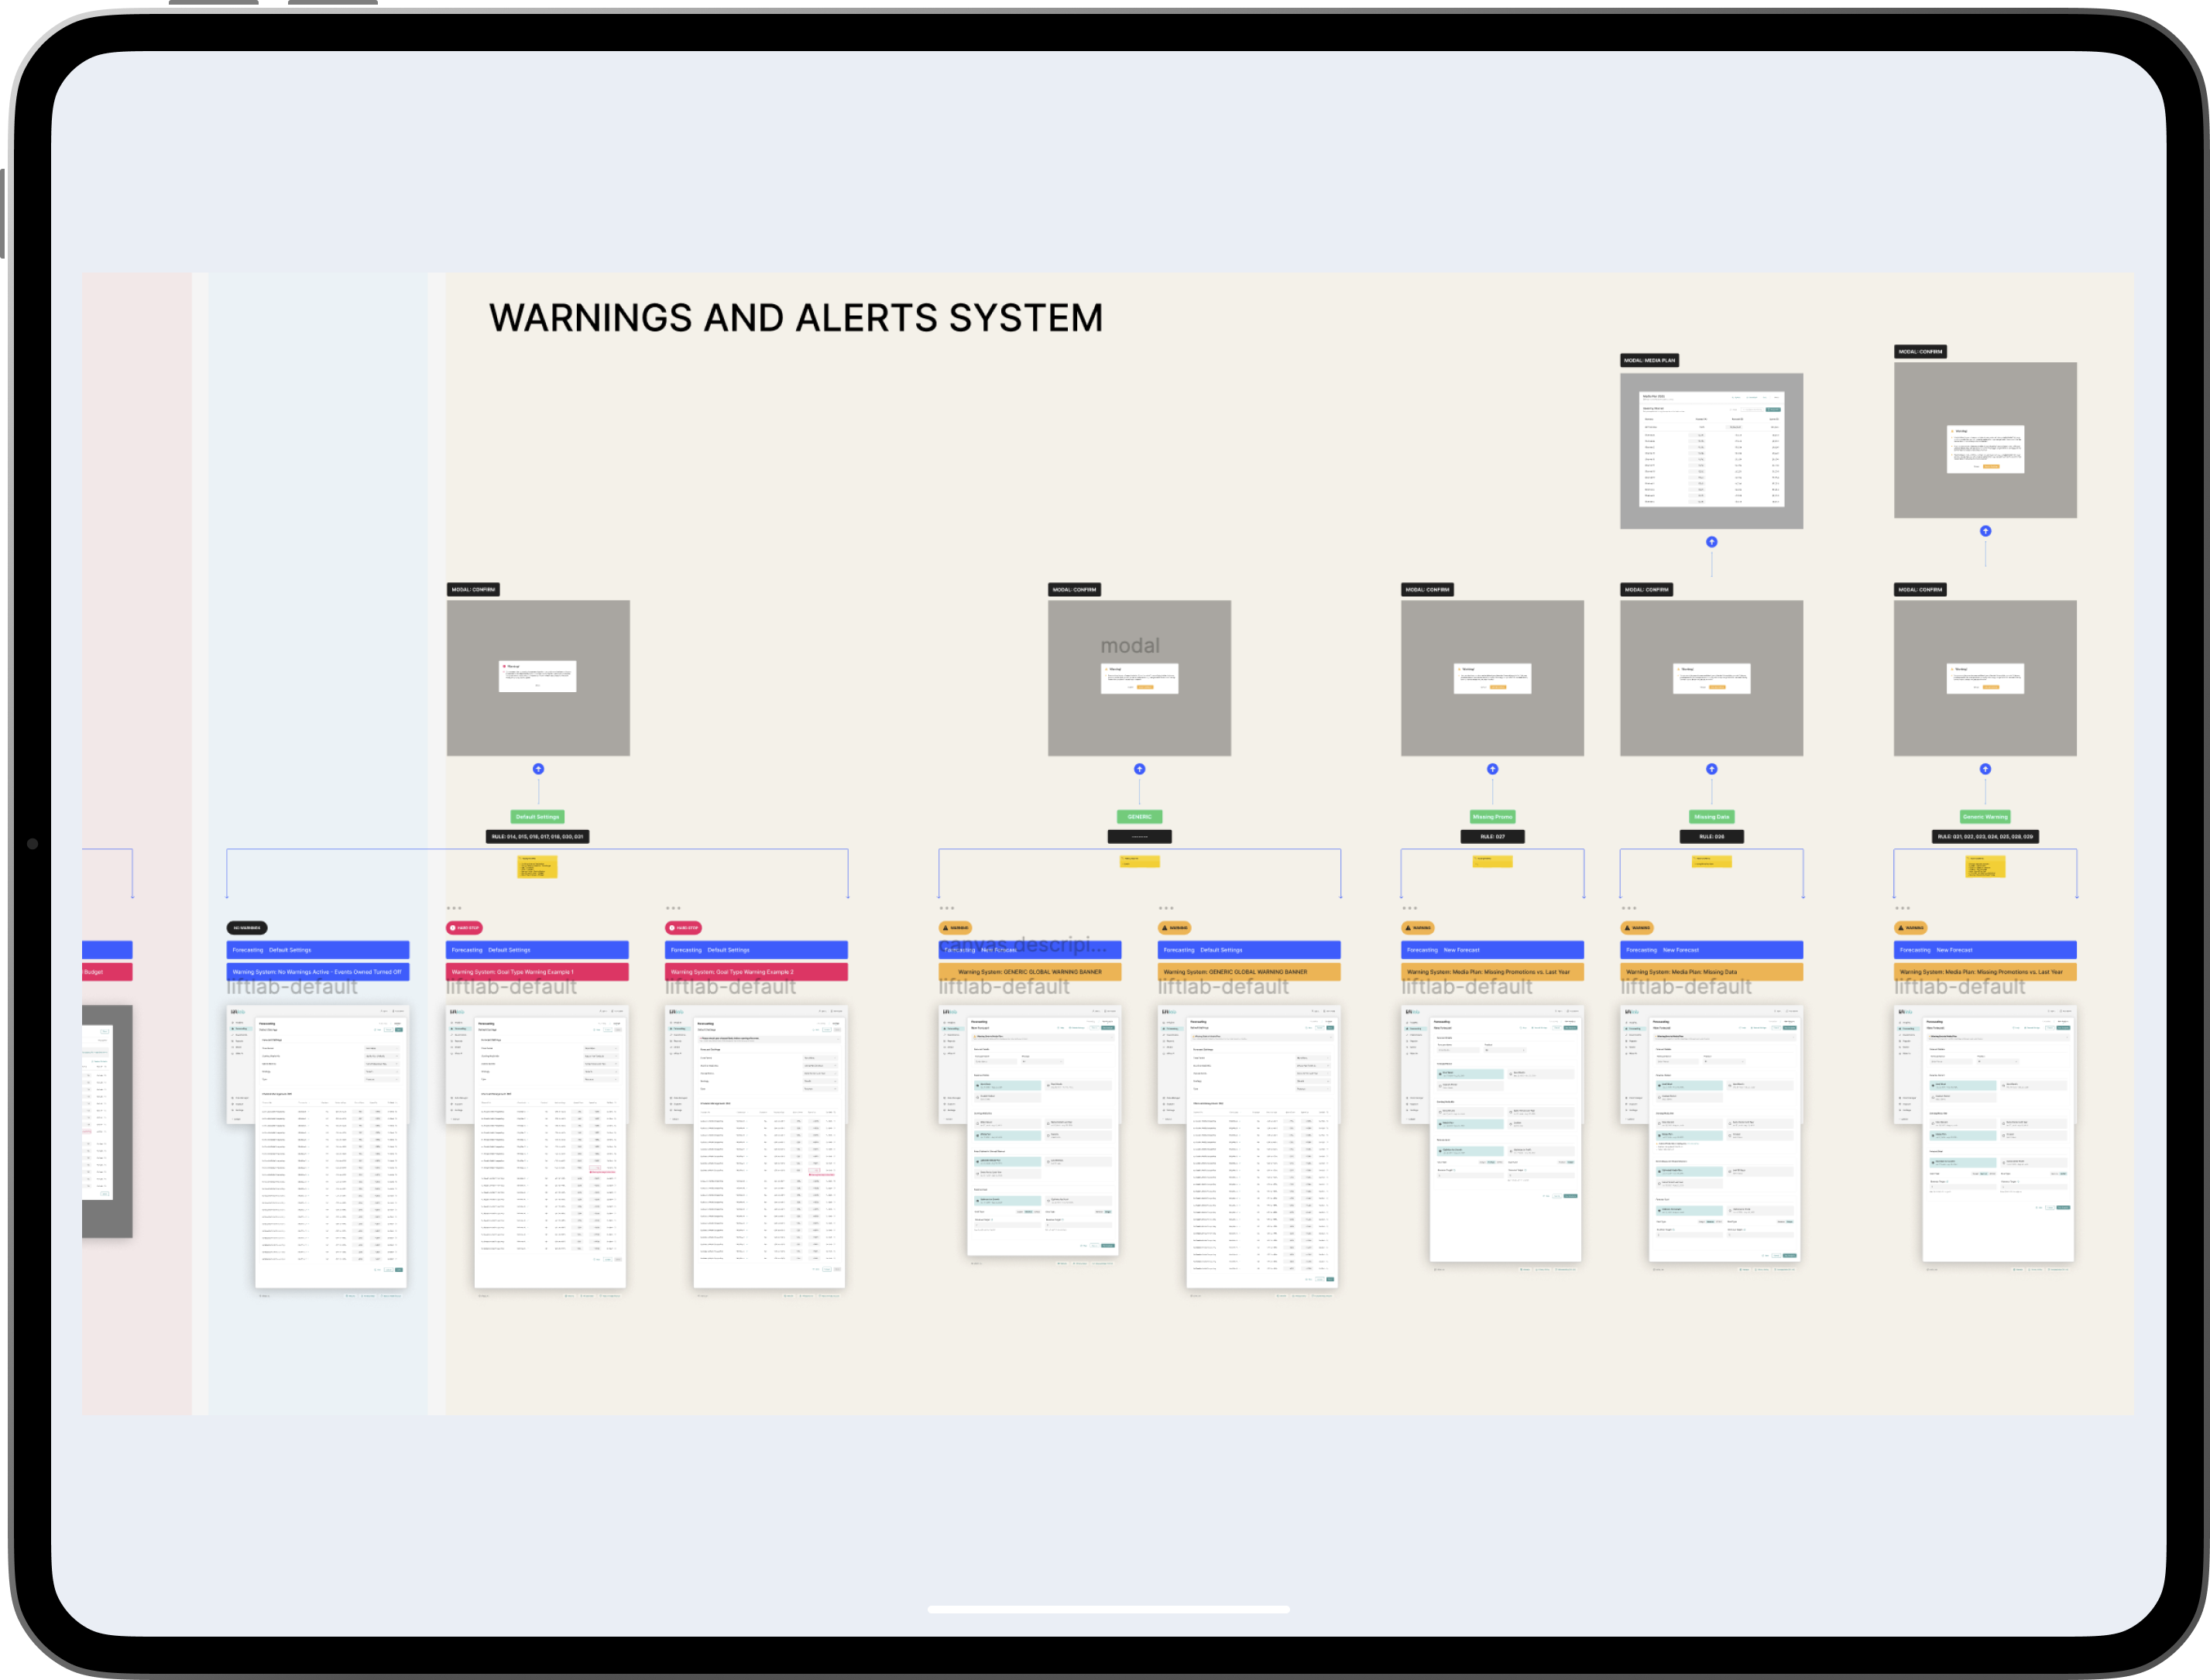
Problem Framing

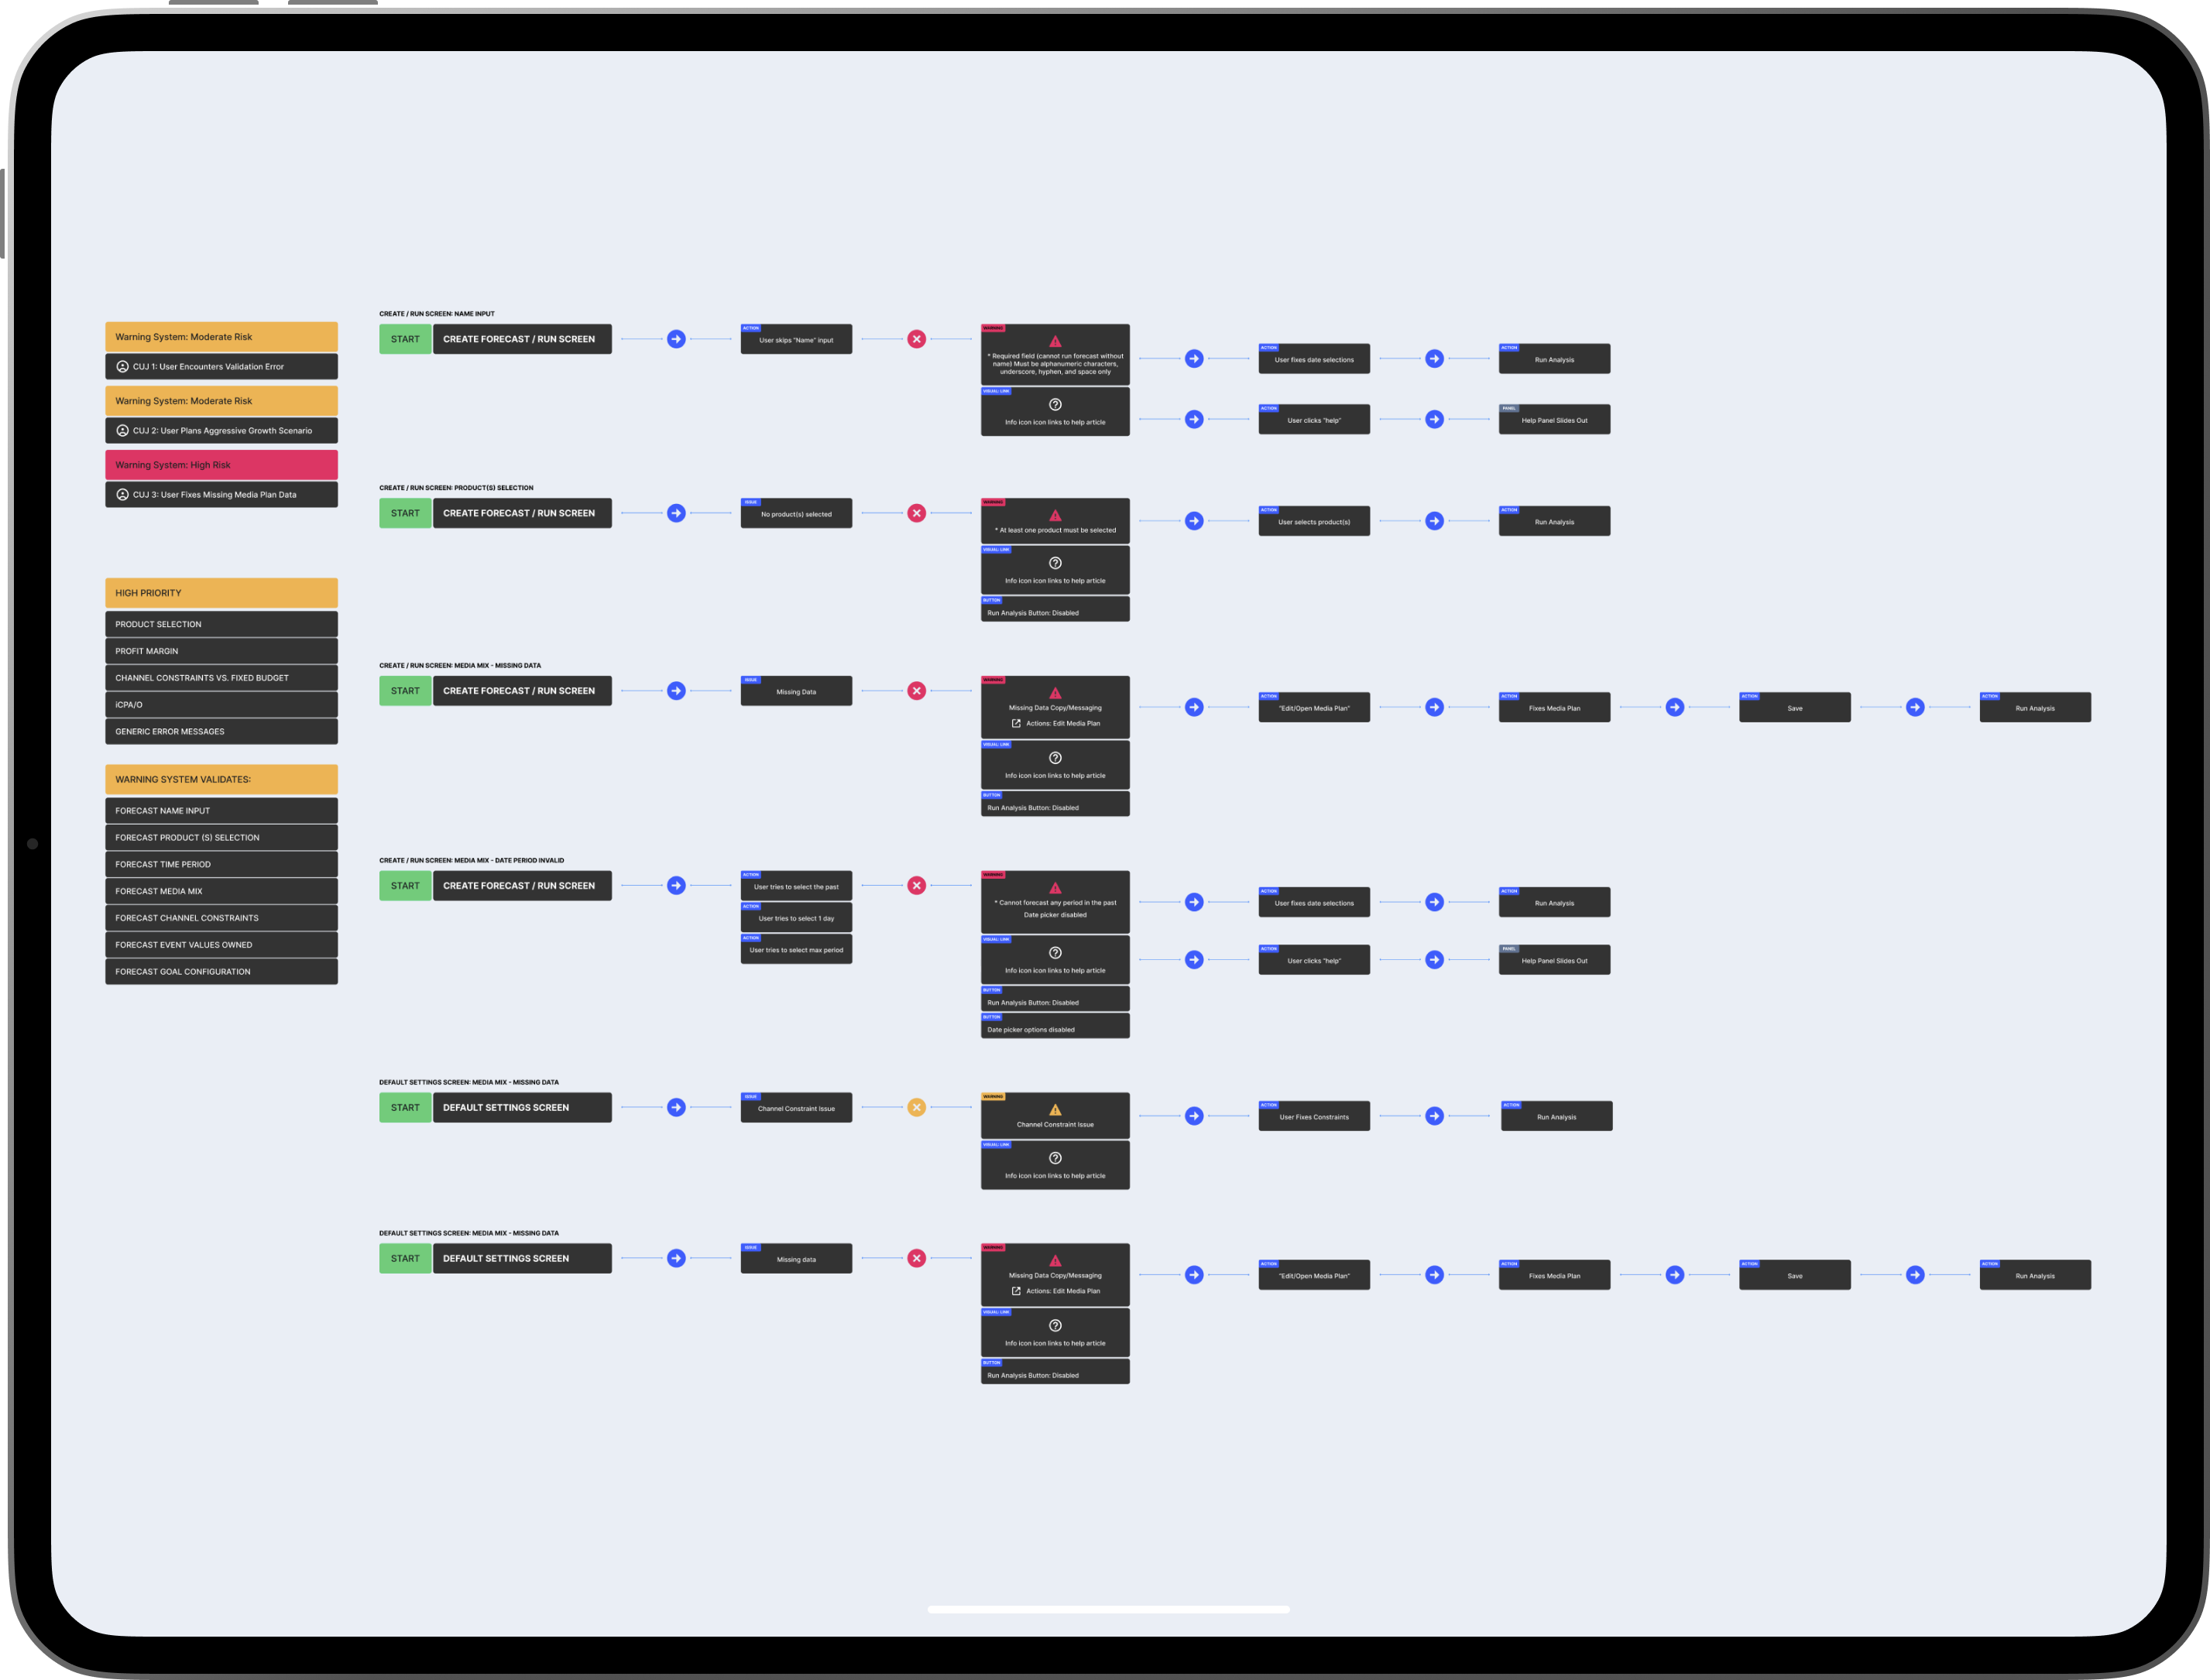
The existing forecasting application was designed several years ago and had become complex, unintuitive, and difficult to use. The power users such as marketing managers, budget leads and executives had a hard time using the application, understanding the value provided and didn’t understand how to accomplish important tasks. Working with CSM’s, product leads, data scientists, engineers and our beta testing clients; I helped lead the re-design and new features design for the updated LiftLab Marketing Budget Forecasting Tool.

Visual Designs - Forecast Dashboards, Results and Optimization Suggestions

Challenges

Outdated Usability, User Experience and UI Design

The original LiftLab forecasting tool was designed several years ago, using an old outdated design system which was missing important components, usability documentation, and design system documentaiton.

Slow Process

The previous version of forecasting was missing essential functionality such as the ability to edit advanced and default settings / configurations before running a forecast.

No Guidance / Constraints

The old forecasting tool, enabled users to seriously mess up their budget and spending configurations without any warnings or blockers.

Not Proactive

In the older version of the LiftLab forecasting tool, users had no insights or visibility into their marketing budget forecasts unless they ran one on their own; the idea here was to pre-run a forecast in the background and always show the results of that forecast in the forecasting landing page.

Quick Insights

Forecast Accuracy

+ 43%

Time to create a budget

90% faster

Time to create a forecast

79% faster

Average Contract Value

+ 12%

Process

My process included market research, user testing and interviews, wireframe and prototypes, reviews and testing. Final designs and developer collaboration for implementation and launch. In collaboration with product, engineering, stakeholders, csms and data scientists; I lead product design and usability testing for the entire end to end project cycle.

Discovery

Conducted user interviews, market research and user testing to identify user pain points, missing functionality and usability issues.

Wireframes and Prototypes

Created mockups, wireframes and clickable prototypes to help test the user flows, user interactions and user experience accessibility.

User Testing

In collaboration product, we conducted user testing on our existing enterprise beta clients and power users.

Final Designs and Deliverables

In collaboration with engineering, I delivered fully annotated final visual designs and prototypes to help engineering teams to implement the new UI.

Process - Wire Frames

Settings and Configuration

Default Configuration Presets

Forecasting Summary Panel

Recommendations based on Historical Data

Settings and Configuration

Settings and Configuration

Settings and Configuration

Process - Wire Frames - Dashboard and Default Setting Views

Dashboard Wire Frames

Dashboard Wire Frames

Forecast Light Settings Views

Forecast Light Settings Views

Outcomes and Key Learnings

Forecast accuracy

Before updates: 62% average, after update: 88% average; up 26% (Exceeded 20% goal, showing a more reliable product).

Budget Creation

Before the re-design and updates to forecasting it took an average of 3-4 days of manual work to create budgets, now it takes 4 hours in-app. 90% faster.

Adoption Rate

75% of target enterprise clients using the feature monthly.

Business Impact

Contributed to a 15% lift in average contract value (ACV) for clients on the premium tier.

Visual Designs - Forecast Settings, Advanced Configuration and Defaults

Forecast Creation Default Settings

Create Forecast Default Settings

Forecast Settings Updated Views

Forecast Default Settings Config A

Forecast Default Settings Date Picker

Forecast Default Settings Config A - Forecast Goals

Forecast Advanced Settings Views

Forecast Advanced Settings Modal Views

Forecast Light Settings Views - Scrolled Events

Process - User Flows and Information Architechture / Prototypes

Process - Prototypes, User Testing & Design System

User Testing and Prototyping

User Testing and Prototyping

User Flows and Warning Systems

Design System Documentation

Research and Competitive Analysis